


Gold Sell-Off, Now What?
Commodities / Gold and Silver 2011 Aug 25, 2011 - 06:48 AM GMTBy: Willem_Weytjens

 After reaching an all-time high well above $1,900 earlier this week, gold is now about $200 lower, just two days later.
We have been saying more than once that we should expect these kind of volatile moves in a parabolic end phase. The difficulty of parabolic moves, is to guess when it pops, and to get a chair before the music stops playing, because WHEN it pops (it always does at some point), the move down is very violent, like we have seen over the last 2 days.
As we can see in the chart below, Price tagged the 20 days Exponential Moving Average (20EMA) yesterday, and held at the close. Next support would be the 20 days Simple Moving Average around $1,740, followed by the 50EMA at $1,662 and about $1,585, which is the lower bollinger band, the 100EMA and the April/May high.
The RSI should now hold above 50, in order to remain bullish.
The MACD will most likely make a negative cross, but that doesn’t necessarily mean that the uptrend is over.
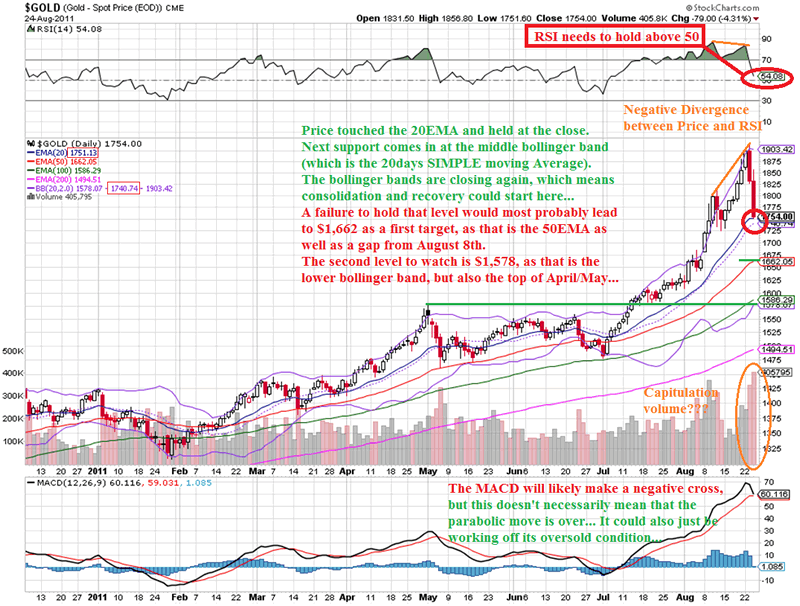
Chart courtesy stockcharts.com
If Price would hold around current levels (AT CLOSE), we might see the uptrend resume pretty soon, and then this move down was probably a move to shake out the weak hands, as sentiment was too bullish a couple of days ago, as can be seen in the following chart (courtesy sentimentrader.com):
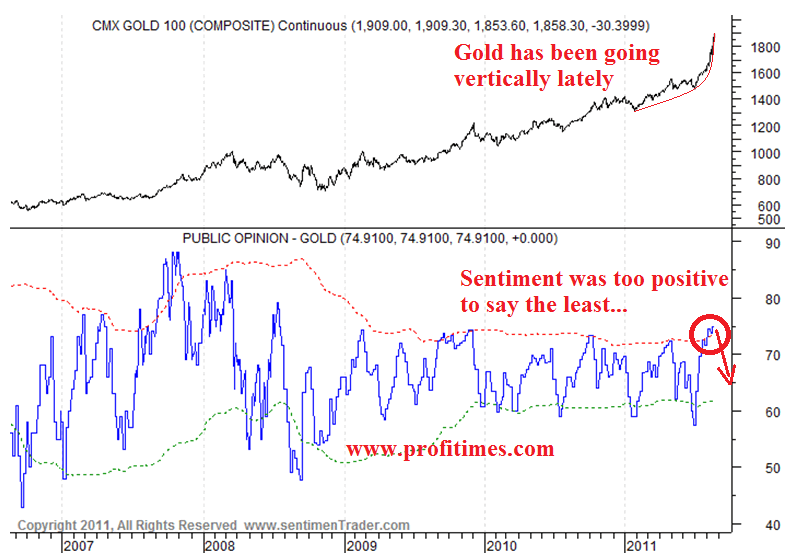
After two days of panic selling, we can expect sentiment to be headed in the other direction now.
The fact that bothers me, is the lack of participation of the mining stocks in the recent rally.
We have been saying this in several articles on our website, i.e:
* Back to the Future: Gold, JPY, DAX, Paulson, Crash?!?
* HUI:GOLD vs Bank Of America
One can argue that Gold mining stocks are severely undervalued (I agree, based on lower oil prices, and record high gold prices), but technical indicators don’t look all that positive…
The Negative Divergence between the price of the HUI index and the RSI is also confirmed by a lower top for the MACD.
The HUI index seems to be forming a Head & Shoulders pattern.
The last two times price pierced the upper bollinger band, it failed to hold these levels, and that meant the start of a severe correction.
Will this time be any different?
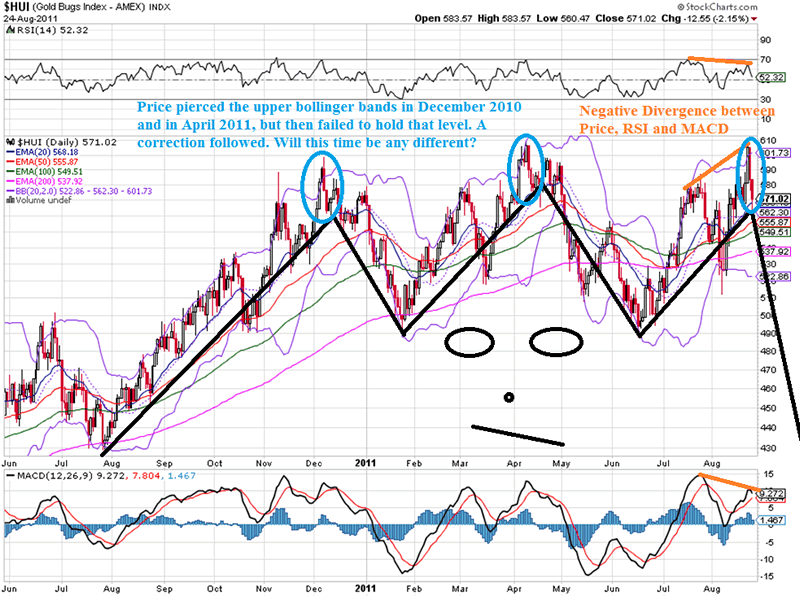
Chart courtesy stockcharts.com
***** You can now try out our services during 5 days for only $5. That is only $1 per day! For more information, please visit the following Link: $5 Trial *****
Willem Weytjens
www.profitimes.com
© 2011 Copyright Willem Weytjens - All Rights Reserved
Disclaimer: The above is a matter of opinion provided for general information purposes only and is not intended as investment advice. Information and analysis above are derived from sources and utilising methods believed to be reliable, but we cannot accept responsibility for any losses you may incur as a result of this analysis. Individuals should consult with their personal financial advisors.
© 2005-2022 http://www.MarketOracle.co.uk - The Market Oracle is a FREE Daily Financial Markets Analysis & Forecasting online publication.