


Stock Market Bears Yell Fire in Empty Theater
Stock-Markets / Stock Markets 2011 Aug 17, 2011 - 12:28 PM GMTBy: David_Banister

 Let’s clarify the SP 500 situation here:
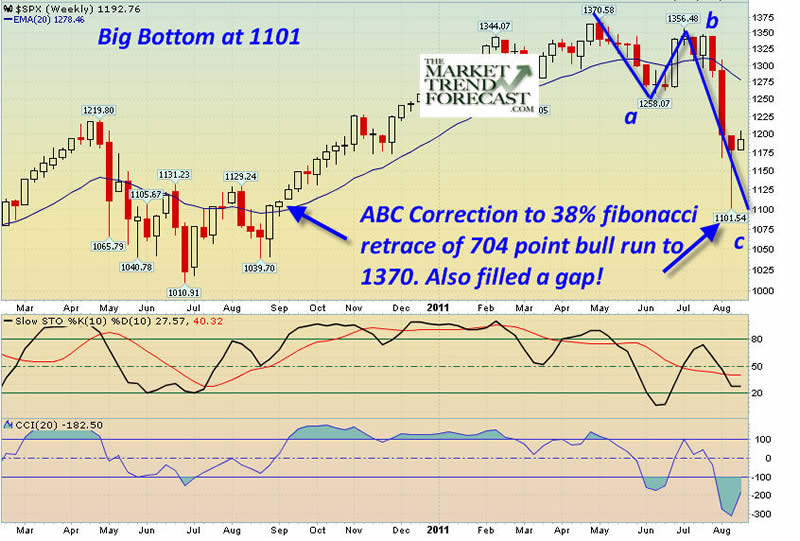
The lows at 1101 were a convergence of fibonacci weeks, months, sentiment bottoms and VIX extremes along with major insider buying all at the same time.
We rallied up in 5 waves from 666 to 1370 Bin Laden highs. At that level we had re-traced 78.6% of the entire 2007 highs to 2009 lows, a common turning point. Since then, we have had a 3 wave decline, also common for correcting a 5 wave move to the upside. The decline halted at 1101, an exact 38% fibonacci retracement of the 666 lows to 1370 highs. This is what I call a “fibonacci intersection”. The same thing happened in July 2010 at 1010 on the SP 500, where a huge bottom formed.
The rally since 1101 was a 5 wave rally, this is an early BULL SIGN.
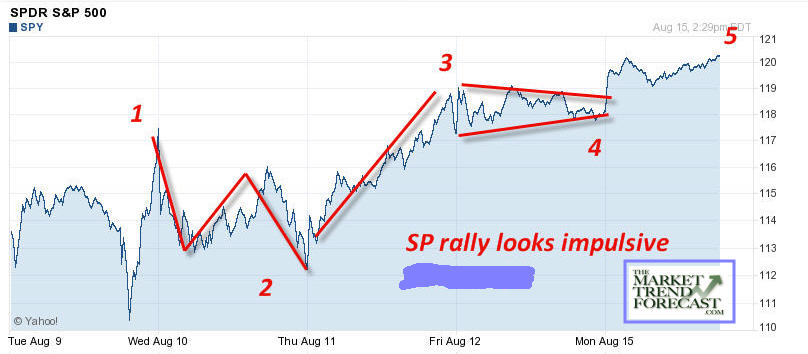
A correction of this 103 point 5 wave rally would be normal, but the lighter the correction the more Bullish. So far the correction is only 23% of the 104 point rally with a gap fill at 1180.
Let’s review:
13 fibonacci month’s from the July 2010 bottom to August 2011 bottoms
7 Times in history we had the SP 500 double ina short period of time, and in every case it retraced 27-40% of the price movement from lows to highs. We just retraced 40% of our SP 500 double, historically very high retracement.
At 1101 we had 38% fibonacci ABC correction of the Bull leg from 666 to 1370
In 1974-77 we had the SAME pattern, which I outlined for everyone last week.
13 Fibonacci weeks correction from the Bin Laden 1370 highs to 1101 lows. 1370 was a 78% fib of the 07 highs and 09 lows. 1101 is a 38% fib of the 666 lows and 1370 highs. Thats what I call a Fibonacci intersection. The same thing happened in July 2010 at 1010 lows.
Insiders with massive buying, corporate buybacks announced.
VIX at extreme levels
Fear gauges at extreme levels.
5 wave impulsive rally from 1101 to 1204 ensued… now a pullback is due. Same thing happened last summer 1010 to 1130, pullback to1040 in 3 waves, then another 5 waves up.
What am I telling everyone?
Stop yelling fire in an empty theater….
This is options expiration week, trading this week is notoriously difficult…
The Bear case is crowded, the Bull case is not.
I’m leaning bullish as long as I keep seeing this type of confirming price action.
I’m watching 1165 on SP 500 as a pivot low worst case, but as long as we see price action above that I like the set up for a while yet on the long side.
(But Dave, the textbook for Elliott Waves doesn’t agree with you… good, that’s why I use other indicators)
Consider subscribing so that you will be consistently informed, have 24/7 Email access to me with questions, and also get Gold and Silver forecasts on a regular basis. Subscribe now with a 33% discount coupon ahead of our rate increase. www.markettrendforecast.com for details.
Dave Banister
CIO-Founder
Active Trading Partners, LLC
www.ActiveTradingPartners.com
TheMarketTrendForecast.com
Dave Banister is the Chief Investment Strategist and commentator for ActiveTradingPartners.com. David has written numerous market forecast articles on various sites (SafeHaven.Com, 321Gold.com, Gold-Eagle.com, TheStreet.Com etc. ) that have proven to be extremely accurate at major junctures.
© 2011 Copyright Dave Banister- All Rights Reserved
Disclaimer: The above is a matter of opinion provided for general information purposes only and is not intended as investment advice. Information and analysis above are derived from sources and utilising methods believed to be reliable, but we cannot accept responsibility for any losses you may incur as a result of this analysis. Individuals should consult with their personal financial advisors.
© 2005-2022 http://www.MarketOracle.co.uk - The Market Oracle is a FREE Daily Financial Markets Analysis & Forecasting online publication.
Comments
|
17 Aug 11, 17:01 |
you gotta be kidding
see your bullish ass in the unemployment line |