


Gold Stocks and QE2.5
Commodities / Gold & Silver Stocks Aug 15, 2011 - 07:34 AM GMTBy: Neil_Charnock

 The fall into that “Elusive Abyss” has been averted once again thanks to action by the ECB and the Fed. The Fed has just offered a new QE (QE = quantitative easing) program, technically speaking that is. The Fed has announced that it will keep rates at incredibly accommodative levels for at least two more years allowing the banks to play the yield curve. Banks borrow from the Fed and then, instead of lending it into the corporate sector and CME’s, they buy Treasuries to lock in guaranteed profits.
I wrote over a year ago that this was happening and needed to happen for at least two years for the banks to rebuild their balance sheets. Like it or not if the banks go down (fail) we will all suffer. More on how this all works in the general economy can be read in the latest article from Peter Schiff, “The Fix Is In” (brilliant must read). This is incredibly accommodative monetary policy by the Fed; it guarantees the world will continue along the current course maintaining current trends for some time yet and fits with my investment modelling assumptions at this time.
For experienced watchers of the precious metals Bull market you may have noticed that the dynamics of gold, silver and gold stocks have just changed again. This change is what has just attracted a new group of investors to this investment class. For new comers to this asset class welcome; you have not arrived too late this is a long way from over. This new change in sentiment is an evolution caused by a number of significant factors which are combining to increase demand for gold.
Gold just reached a new record high across a range of currencies and it managed this feat with powerful momentum as shown by the RSI reading of 85.429 on the day, at the top. Gold reached a record US$1,814 per ounce last week (intra-day high) and it also reached record highs in the € Euro, £ UK Pound, ¥ Yen, CDN Canadian dollar and the AUD Australian dollar. The only major currency not found below its own previous record low against gold was the CHF Swiss Franc.
Gold stock share prices have lagged the price performance of gold several times throughout the gold rally since 2001. This is cyclic in nature, the rising incomes of the producers soon spurs renewed investor interest at the new higher price level. The price levels have progressively stepped up ever since I began watching gold more closely in 2001. A new higher price range is reached and then the price consolidates before launching a new rise to each new price level. This has created the step up chart pattern clearly visible on daily or weekly spot gold charts going back many years.
As the currencies fluctuate around against each other they gradually decline in value against gold. These fluctuations also affect the earnings of the companies domiciled in each of these currencies. A rising currency will mute the profit potential and therefore the share price of any gold stock producing gold in that currency; therefore investors like to see a falling currency against other currencies. This is the exchange rate factor. I know this is very basic but important for many investors to recap at this time. Offshore investors can lose on the exchange rate or enhance profits by moving capital into markets on a major dip in the currency, especially if there are gold stock bargains to be snapped up.
Here is an AUD: USD 12 month daily chart – upside down to US viewers. US viewers might view this ratio in reverse however the same technicals apply in reverse also. I marked the main support / resistance line in red and the break point where it crossed back in March this year. We just tested this line and it held on the first test after a short penetration to the downside. However it also coincided with a negative divergence at point B and that deep RSI low. Only time will tell however fundamental indicators are flashing a warning that we face some more downside in the Australian economy. This is great for locally listed ASX gold stocks.
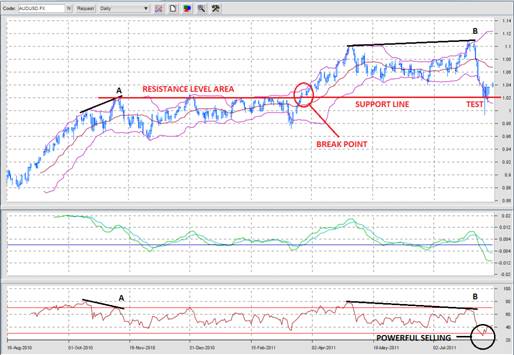
Back on the 9th August one week back) I wrote an article “The Elusive Abyss” and at the end I stated: “Now the AUD: USD ratio is back in the support range it is certainly a better time for US dollar holders to invest in our gold stocks.” Gold stocks reversed back up and so did the AUD creating a double whammy bonus (short term so far) however I see a significant potential for much more to come. It is likely that we will continue to see rising ASX gold stock prices (XGD index) now as a trend after a long 11 month consolidation. More on this if you read further down.
Today I had a conversation with a renowned veteran Fx trader who had predicted (many months back) a negative outlook for the Australian economy by this time. We both share the view that the AUD has just had a bit of a bounce here and has more downside. The USD holders that agreed with what I said a week back did very well because they were able to snap up some really nice bargains in this gold sector Down Under. The AUD: USD ratio will present another opportunity shortly for US investors to get some capital down here to participate. We see the USD falling against another major currency however the AUD may fall further for a time.
Here is a short excerpt from GoldOz Newsletter 42 you might find interesting because it relates to the exchange rate and the Aussie gold sector in general: “Now here is the interesting thing – the RSI sunk to that low I circled, down to 26.65. This is the exact opposite of the RSI spike in gold as it indicated extreme weakness – internal weakness compared to previous selling on the AUD. This was not profit taking it was long covering and it was heavy. The signal means we can see further AUD falls perhaps on perception of lower rates, more risk off on turmoil or an actual rate cut here by the RBA. This has changed the perception of gold stocks here and this will cause a re-rating over coming months.
The re-rating will be significant because the stocks have lagged the gold price rise in local terms pretty much since $730 per ounce! Rising costs have impacted the effect of the rising price however nowhere to the degree we have seen in the share price lag. The value distortion has therefore been significant and a great deal of this may have been due to the rising AUD which muted our miners’ earnings. I have long predicted that the historic undervaluation of the Australian gold sector compared to North American stocks would change when conditions were right – driven by the enormously increased information flow and accessibility created by the internet – since the last gold boom in the late 70’s. The leverage effect could be staggering if I am right.”
Gold is rising against all currencies over time even the Swiss Franc. Now we have reached a level on gold far enough above the rising cost of production to ensure an upward re-rating for gold stocks. Thanks to Nick at Sharelynx I am able to display the following chart at GoldOz and in this article:
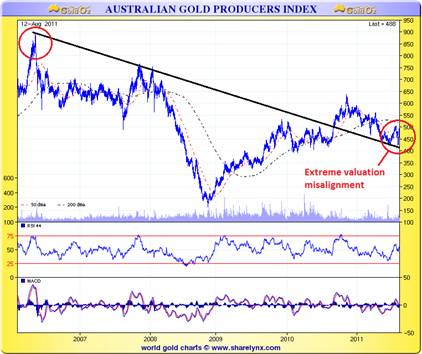
As I said above the price of gold was $730 per ounce back in May 2006 and here is the chart of the gold producers on the ASX. The red circle on the right is where we are now with gold at AUD$1664. This chart shows a sideways consolidation over the past two years. This chart is not weighted; I have that essential picture for you below before I sign off.
Here is the 24 month XGD vs XAO chart showing that the gold stocks are now running their own race.
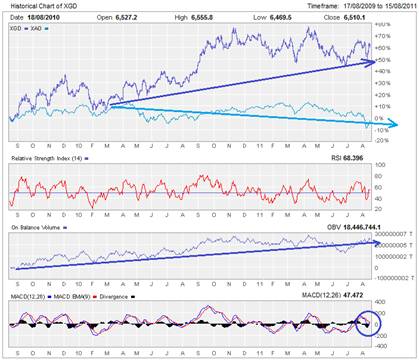
Gold stocks began to disconnect long ago and few have recognised this I still see comments of concern on general stocks. The correlation between ASX gold stocks and the general market is diminished significantly. The light blue arrow follows the general market leaders and the rising darker blue arrow shows the XGD launching slowly upwards driven by a few leading stocks. Most of these are represented in the GoldOz Educational Portfolio (subscribers only) FundB which is the less aggressive fund. It was up in the bottom of the recent corrections with cash to add, despite the February 2011 starting date. We provide the how to for subscribers to teach them about gold stock investment without recommending stocks, because we have no equities desk; we are independent.
Some education to share here however shows the rising OBV – on balance volume as the smart money loads up ahead of a major rally. Down the bottom of the chart I have circled the current picture of the MACD histograms which have narrowed from negative to the neutral position. Much more for subscribers…
We still have our special discount offer on Gold Membership if anybody has interest. Please forgive me if I do not respond to all emails, the rising client base and work load now makes this prohibitive. How you handle your finances at this time is critical, wealth is set to change hands like never before and we hope you are on the receiving end of this flow.
Good trading / investing.
Regards,
Neil Charnock
GoldOz has now introduced a major point of difference to many services. We offer a Newsletter, data base and gold stock comparison tools plus special interest files on gold companies and investment topics. We have expertise in debt markets and gold equities which gives us a strong edge as independent analysts and market commentators. GoldOz also has free access area on the history of gold, links to Australian gold stocks and miners plus many other resources.
Neil Charnock is not a registered investment advisor. He is an experienced private investor who, in addition to his essay publication offerings, has now assembled a highly experienced panel to assist in the presentation of various research information services. The opinions and statements made in the above publication are the result of extensive research and are believed to be accurate and from reliable sources. The contents are his current opinion only, further more conditions may cause these opinions to change without notice. The insights herein published are made solely for international and educational purposes. The contents in this publication are not to be construed as solicitation or recommendation to be used for formulation of investment decisions in any type of market whatsoever. WARNING share market investment or speculation is a high risk activity. Investors enter such activity at their own risk and must conduct their own due diligence to research and verify all aspects of any investment decision, if necessary seeking competent professional assistance.
Neil Charnock Archive |
© 2005-2022 http://www.MarketOracle.co.uk - The Market Oracle is a FREE Daily Financial Markets Analysis & Forecasting online publication.