


Relative Strength of Gold Stocks Signals the Future
Commodities / Gold & Silver Stocks Aug 15, 2011 - 07:04 AM GMTBy: Jordan_Roy_Byrne

Savy and experienced market technicans and traders will laud the concept and importance of relative strength. Relative strength analysis can be used on any time frame. On large time frames it can tell us which sectors could be future leaders. On shorter time frames it can also provide insight to the future. In this analysis we examine the relative strength of the gold stocks today and compare it to the past as some important insights can be gleaned.
In both stock market crashes (1987 and 2008), the gold stocks performed much worse than the market. In the 2007-2009 equity bear market, the gold stocks escaped the start and the end but fell victim to the middle stages when equities crashed. From the September high to October low, the S&P 500 fell by 33% while the gold stock indices fell by about 60%. Checking back to 1987, the XAU plunged 41% while the Dow fell by 34%.
In the recent carnage, the S&P 500 fell by about 19% while large cap gold stocks (GDX) fell 13%. Beyond the numbers there are some important observations here.
In the chart below we plot large golds, junior golds, silver stocks, commodity stocks, emerging markets and the S&P 500. The short-term observation is obvious but important. The mining stocks held their summer lows while the other markets failed and plunged below support. The horizontal line shows each market’s 2007-2008 highs. The gold stocks are trading above their previous all-time high and though SIL doesn’t go back that far we can probably assume its trading above its 2007-2008 highs. Note that commodity stocks and emerging markets failed to surpass that resistance and the S&P of course is furthest behind.
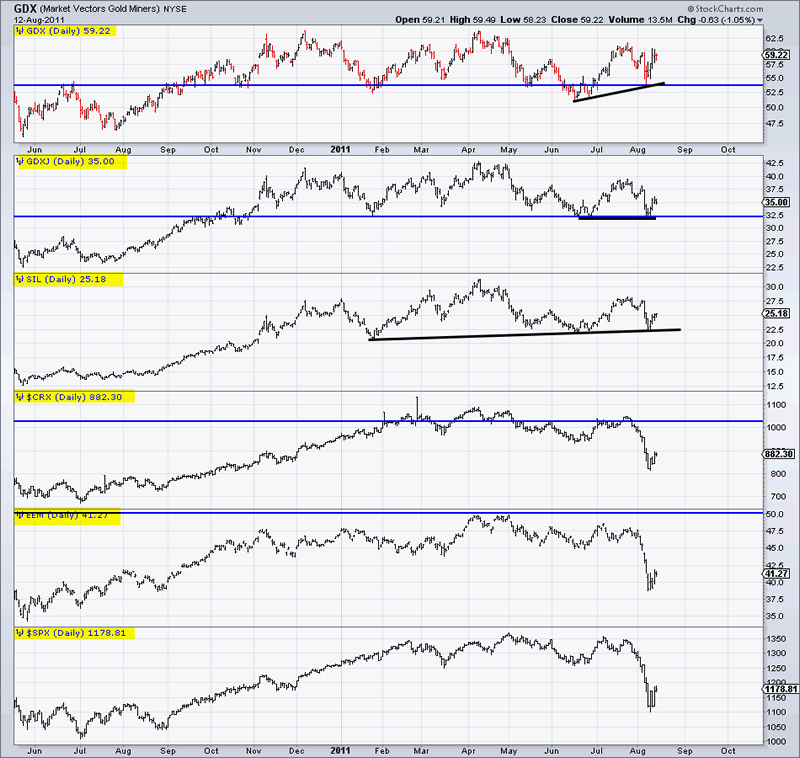
Here is why all of that is important. The various conventional equities not only have to repair significant short-term damage but in the process they face multi-year resistance. Precious metals shares do not have that short-term damage and have already surpassed and successfully retested that multi-year resistance. So what will happen in the next six months as precious metals equities make new highs, Gold is at $2000, Silver at $50 and the average person is looking at their stocks going nowhere?
The next six to nine months should set the table for the beginnings of a bubble in precious metals. Throughout this bull market, other markets have performed well enough at times which has diverted investors attention and capital away from precious metals. With conventional equities fading, major concerns with bonds and relative strength in precious metals, the tables are set for the mining shares over the next few years.
If you’d like to learn more about how to profit, manage risk and have a professional guide you, then you can learn more about our service here.
Good Luck!
Jordan Roy-Byrne, CMT
Trendsman@Trendsman.com
Subscription Service
Trendsman” is an affiliate member of the Market Technicians Association (MTA) and is enrolled in their CMT Program, which certifies professionals in the field of technical analysis. He will be taking the final exam in Spring 07. Trendsman focuses on technical analysis but analyzes fundamentals and investor psychology in tandem with the charts. He credits his success to an immense love of the markets and an insatiable thirst for knowledge and profits.
© 2005-2022 http://www.MarketOracle.co.uk - The Market Oracle is a FREE Daily Financial Markets Analysis & Forecasting online publication.