Stock Market Setting Up For the Next Decline
Stock-Markets / Stock Markets 2011 Aug 14, 2011 - 06:22 AM GMT Last week I left readers with this idea (see graph). Well fast forward and it seems we are setting up for the next move lower in what I suspect is a 5th wave towards lower prices.
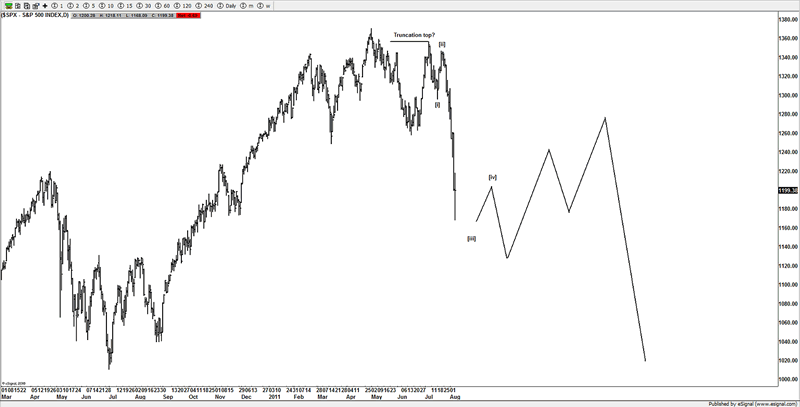
This week saw some crazy swings on 5% of more on the market each day, those sorts of swings are creating some great trading conditions and the traders that are switched on and understanding price action are taking full advantage of the moves.
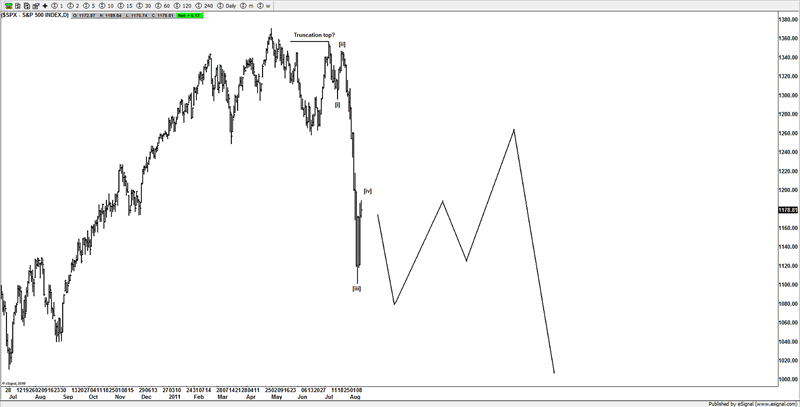
One issue is account size vs trade size, in these sort of conditions, traders need to adjust stops and size of the trade, for the size of the moves we are seeing as if you get on the wrong end of some of these moves, they can be devastating to your account. That being said, these conditions are where you can really make some great trades due to the swings we are seeing on a daily basis.
Currently I suspect we have been working a 4th wave, from the FOMC spike, and from there appears to be a 3 wave move which has finally reached our upper targets.
We went into this went this week looking for the end of wave [iii] and then trying to find a buying opportunity for wave [iv], although some of the swings we saw made conditions a little nerve racking, t we had a plan, as towards the end of week I suspected a trap as a "[b]" wave setting up.
I showed members this chart, and we were aware that the market could really let loose and burn the shorts that sold the lows. I had a felling the market was not finished with the bears that got in too late to sell the market and I felt the market was trying to set up higher before a resumption of the downtrend.
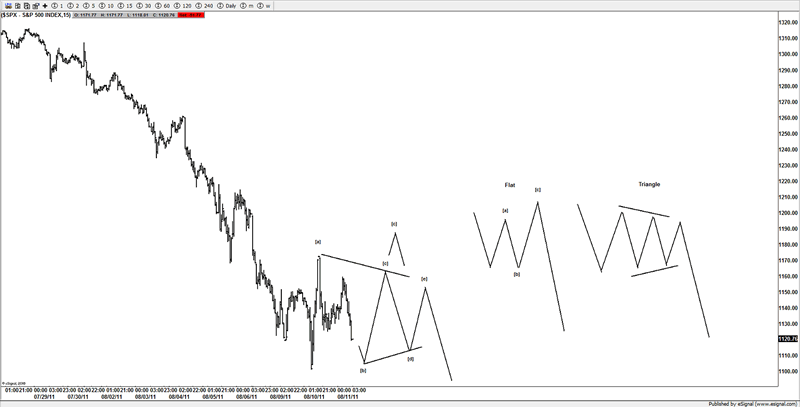
As you can see the flat became the working idea, although as the move pushed higher we were watching both ideas as one by one our upper target levels around 1163ES then 1175ES was hit, and eventually above 1183ES.
By the end of Thursday there was a potential to start a move lower, however some firm buying was seen from one of lower areas at 1147ES which then proceeded to push higher and create a small gap up, which anyone that has traded the past few months knows that Fridays have become a very slow day recently. So it was back to buying dips above 1167ES, and that holds true going into Sundays open, as I still feel above 1167ES then the market wants to test the 1200ES area.
A closer look at the gyrations suggests that we could see a pop on Monday and a reversal, but a chance for aggressive ES traders to buy above 1167ES and look to trade throughout the globex session and potentially see a gap up on the SPX cash market.
We do have a trigger point should see weakness in globex and in the European session, but until that is triggered I think we have a bit of upside left for this current ideas of a 4th wave rally.
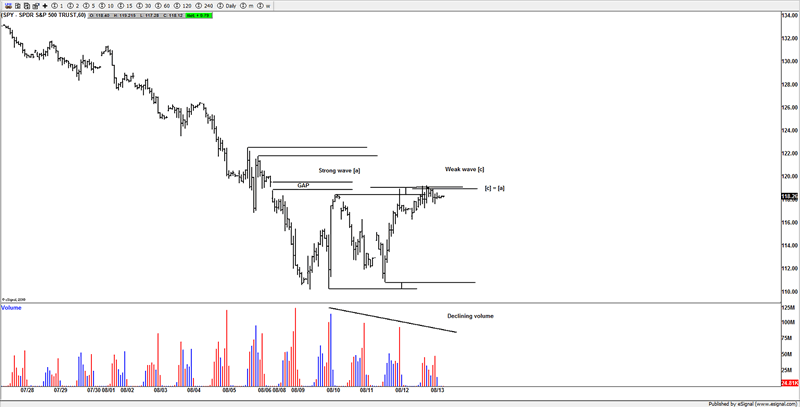
SPY
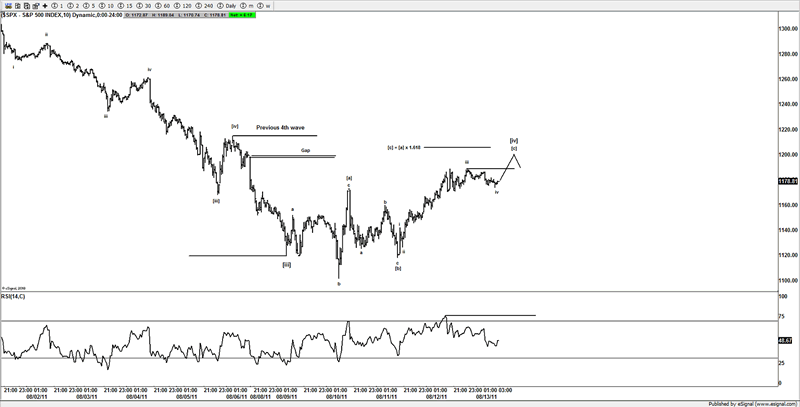
Looking at volume analysis of the SPY volume, it tends to suggest we have a weaker trend in what I suspect is a countertrend bounce against the heavy decline we have seen over the past few weeks.
It's now reached our target and appears to be a 3 wave advance which is corrective and aligns with our ideas of the bounce we have seen being a correction and what Elliotticians refer to a 4th wave.
If you look carefully the volume is declining and it's a normal characteristics of a counter trend move in a wave C of a ABC advance, generally you will see a strong wave A, and the wave C will be weaker, that suggests the move is a correction against the trend, in this case this current move fits in with the profile of a correction.
Unless Monday opens up with a very aggressive upside day, then we appear to be setting up for the next move lower and targets are towards the 1080SPX as there was a ES printed 1077ES in the globex session.
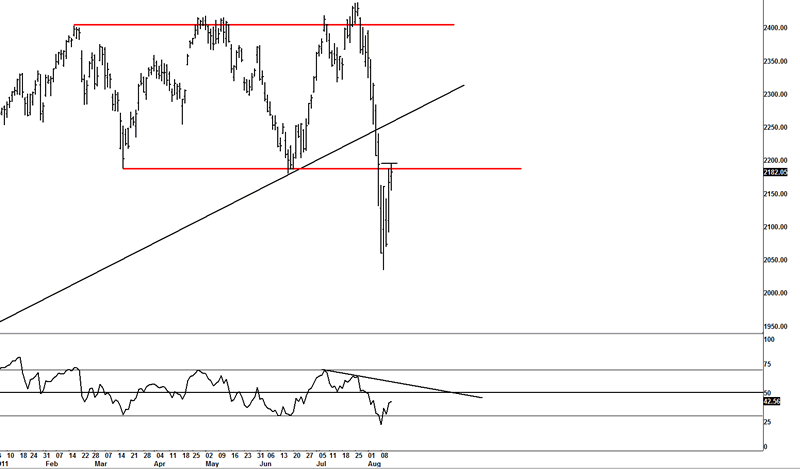
NDX
What was once support now becomes resistance, the NDX is back testing its previous broken support area.
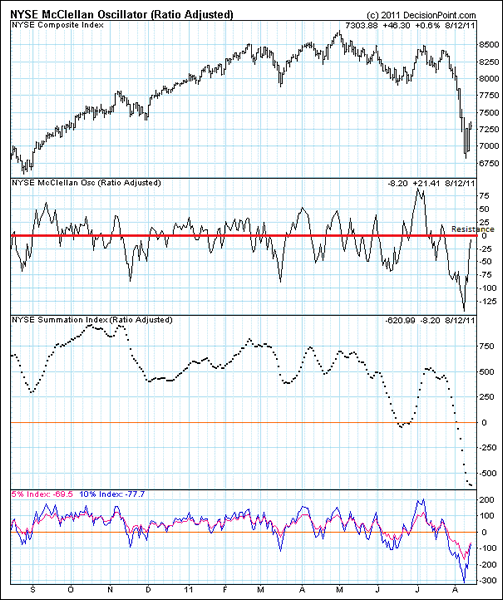
Nyse McClellan Oscillator
With the McClellan Oscillator now re-set from over sold conditions it too is potentially setting up a reversal, as the 0 line will be resistance.
EUR/USD
This pair looks like it is about to setup for an explosive move, only we have 2 working ideas, and until this pair makes its move there is simply no telling which direction its wants to break, but it should be a great move regardless.
Bullish
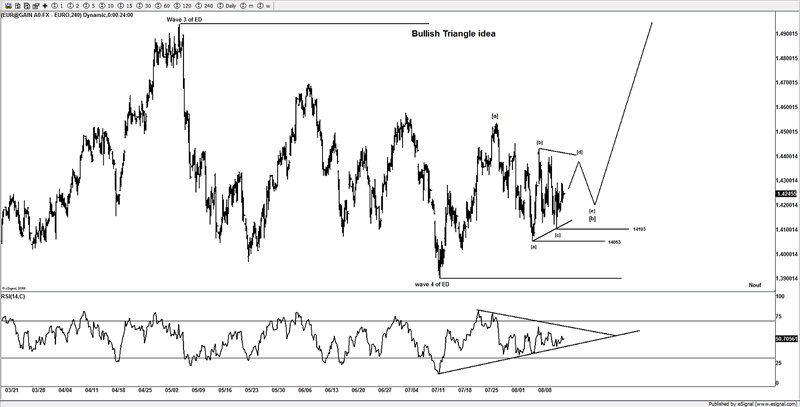
Bearish
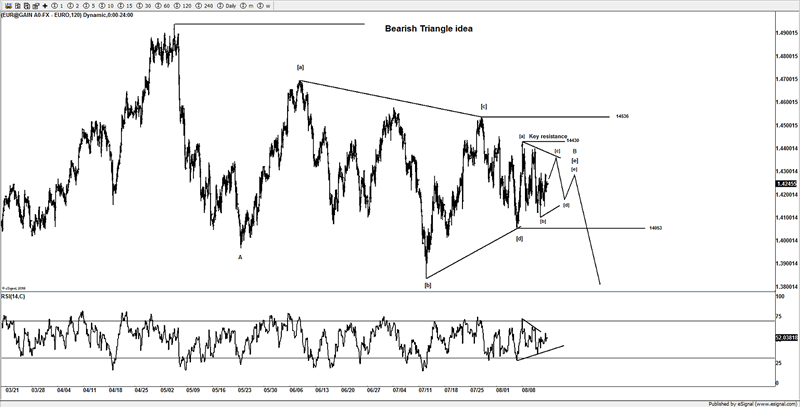
I suspect over the coming days, likely this week that the market will break one set of support or resistance areas and confirm its intentions, then it's a case of jumping on board for the ride as it could be a great trade.
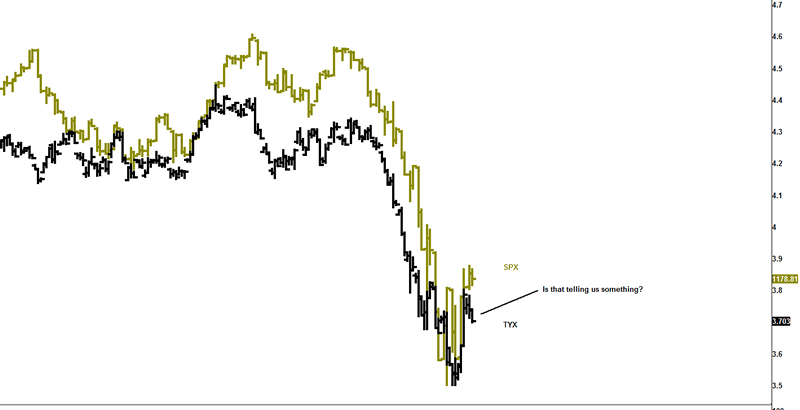
TYX VS SPX
A chart I like to use for timing of trend reversals is that of the TYX, what tends to happen is near reversals, traders tend to move in/out of stocks and bonds, and TYX tends to move a few days before equities reverse, and right now we potentially have such an occasion as traders were buying bonds as stocks were floating and grind higher, which again suggests that some traders trying to get out of stocks and run back into the safety of bond as yields pushed lower on Friday.
Conclusion
Looking at the European and US markets, I suspect the market is setting up for a new move lower, unless it surprises traders early new week, we could see a little bit higher and fill some gaps around the 1200SPX area, before I suspect sellers hit the tape again.
Targets are towards 1080SPX in what could be a better buying opportunity to last a month or so.
We have some key areas on the upside, should the market surprise us and put in an aggressive upside move early next week, then we will have to adjust our bias, currently I expect lower in a 5th wave, but will respect an aggressive move, should buyers decide to go on an aggressive buying spree.
Until next time.
Have a profitable week ahead.
Click here to become a member
You can also follow us on twitter
What do we offer?
Short and long term analysis on US and European markets, various major FX pairs, commodities from Gold and silver to markets like natural gas.
Daily analysis on where I think the market is going with key support and resistance areas, we move and adjust as the market adjusts.
A chat room where members can discuss ideas with me or other members.
Members get to know who is moving the markets in the S&P pits*
*I have permission to post comments from the audio I hear from the S&P pits.
If you looking for quality analysis from someone that actually looks at multiple charts and works hard at providing members information to stay on the right side of the trends and making $$$, why not give the site a trial.
If any of the readers want to see this article in a PDF format.
Please send an e-mail to Enquires@wavepatterntraders.com
Please put in the header PDF, or make it known that you want to be added to the mailing list for any future articles.
Or if you have any questions about becoming a member, please use the email address above.
If you like what you see, or want to see more of my work, then please sign up for the 4 week trial.
This article is just a small portion of the markets I follow.
I cover many markets, from FX to US equities, right the way through to commodities.
If I have the data I am more than willing to offer requests to members.
Currently new members can sign up for a 4 week free trial to test drive the site, and see if my work can help in your trading and if it meets your requirements.
If you don't like what you see, then drop me an email within the 1st 4 weeks from when you join, and ask for a no questions refund.
You simply have nothing to lose.
By Jason Soni AKA Nouf
© 2011 Copyright Jason Soni AKA Nouf - All Rights Reserved
Disclaimer: The above is a matter of opinion provided for general information purposes only and is not intended as investment advice. Information and analysis above are derived from sources and utilising methods believed to be reliable, but we cannot accept responsibility for any losses you may incur as a result of this analysis. Individuals should consult with their personal financial advisors.
© 2005-2022 http://www.MarketOracle.co.uk - The Market Oracle is a FREE Daily Financial Markets Analysis & Forecasting online publication.


