Wall Street Bailout: Too Big To Collect?
Interest-Rates / US Debt Aug 13, 2011 - 04:35 PM GMTBy: EconMatters
In light of the recent S&P downgrade of the U.S. sovereign credit rating, the nation suddenly looks more dire financially than before the downgrade ( (at least psychologically, as the country still has the ability to borrow at its pre-downgrade low interest rates.) So it would make tracking down Wall Street bailout money still outstanding a good start to reclaim some of the lost treasure.
However, more than two years after the bailout, there never seems to be a straight answer to these two questions: (1) Where has Uncle Sams' bailout money gone? (2) Has the money been paid back yet?
The Treasury Dept. already declared milestone reached in June, 2010 when "Repayments to Taxpayers Surpass Tarp Funds Outstanding." New York Times and CNNMoney both keep stattistics of the bailout and tell a different story from the government's account. NYT says fund outflow has amounted to $550 billion, funds returned is $70.1 billion, that leaves amount outstanding $480 billion. CNNMoney data suggest $475 billion out of the door, $118.5 billion returned, netted to $357 billion still needs to be collected.
Pro Publica also keeps track of a bailout list including the $700 billion TARP program, and the separate bailout of Fannie Mae and Freddie Mac. According to Pro Publica,
"Altogether, accounting for both bailouts, $580 billion has gone out the door—invested, loaned, or paid out—while $273 billion has been returned. The Treasury has been earning a return on most of the money invested or loaned. So far, it has earned $67 billion. When those revenues are taken into account, $239 billion is the net still outstanding as of August10, 2011."The spreadsheet downloaded from Pro Publica shows the top 5 bailout deadbeat recipients--Fannie Mae, AIG, Freddie Mac, General Motors, and GMAC (now Ally Financial)--account for almost 97% ($232 billion) of the total net amount still outstanding.
Now, the more jaw dropping numbers come from a recent analysis done by the Center for Media and Decmocracy (CMD), pointing to an actual total still outstanding at $1.5 trillion (See Chart),
".....while the TARP bailout of Wall Street (not including the bailout of the auto industry) amounted to $330 billion, the government also quietly spent $4.4 trillion more in efforts to stave off the collapse of the financial and mortgage lending sectors. The majority of these funds ($3.9 trillion) came from the Federal Reserve, which undertook the actions citing an obscure section of its charter."
"..$4.8 trillion went out the door to aid financial companies and repair the damage they caused to financial markets, and $1.5 trillion of that is still outstanding."
CMD keeps a list of 'Total Wall Street Bailout Cost' here, but not down to the detail recipient level. CMD’s analysis also shows that most of the bailout funds were comprised of aid to banks, in the form of loans with below-market interest rates and for questionable collateral to banks directly from the Treasury and Federal Reserve (See Chart).
The $4.8 trillion bailout of the financial sector, according to CMD, also dwarfs the $600 billion that the Federal Reserve spent on the QE2 that was intended to stimulate the broader economy.
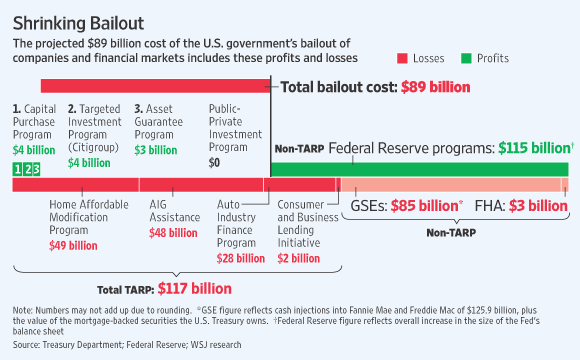
Andrew Ross Sorkin at NYT also pointed out that when WSJ quoted the U.S. Treasury that "the projected cost of the bailout is shrinking" to $89 billion from an earlier estimate of $250 billion (see graph below),
So it looks like the bailout could have different ROIs (return on investments), depending on what you count as "investments.""....there’s a small problem with all this happy Washington math: it doesn’t take into account the piles of cash we’re likely to lose on Fannie Mae and Freddie Mac..... The overall math also doesn’t account for the more than $1 trillion the Federal Reserve pumped into the system through loans to Wall Street that were virtually interest-free."
Source: WSJ.com
Fannie and Freddie just recently asked for $7 billion more bailout funds, and looking at the domestic housing market and the current economic outlook, American taxpayers probably should consider it a draw even if just no future funding will be directed to the two government-sponsored housing entities, let along expecting a single dime coming back form Fannie and Freddie.
But the sad thing is that even if Uncle Sam gets to collect the whole 1.5 trillion as calculated by the CMD, it would not have made a difference in the debt and deficit of the U.S. government (as the S&P Rating Agency has taught us.)
By EconMatters
The theory of quantum mechanics and Einstein’s theory of relativity (E=mc2) have taught us that matter (yin) and energy (yang) are inter-related and interdependent. This interconnectness of all things is the essense of the concept “yin-yang”, and Einstein’s fundamental equation: matter equals energy. The same theories may be applied to equities and commodity markets.
All things within the markets and macro-economy undergo constant change and transformation, and everything is interconnected. That’s why here at Economic Forecasts & Opinions, we focus on identifying the fundamental theories of cause and effect in the markets to help you achieve a great continuum of portfolio yin-yang equilibrium.
That's why, with a team of analysts, we at EconMatters focus on identifying the fundamental theories of cause and effect in the financial markets that matters to your portfolio.
© 2011 Copyright EconMatters - All Rights Reserved Disclaimer: The above is a matter of opinion provided for general information purposes only and is not intended as investment advice. Information and analysis above are derived from sources and utilising methods believed to be reliable, but we cannot accept responsibility for any losses you may incur as a result of this analysis. Individuals should consult with their personal financial advisors.
© 2005-2022 http://www.MarketOracle.co.uk - The Market Oracle is a FREE Daily Financial Markets Analysis & Forecasting online publication.


