


Run, Ride or Buy? What Should Stock Market Investors Do?
Stock-Markets / Stock Markets 2011 Aug 10, 2011 - 06:52 AM GMTBy: Frank_Holmes

 There’s an old contrarian investing maxim from Baron Rothschild that says “the time to buy is when there’s blood in the streets, even if the blood is your own.” The idea is that the best investors strategize when others panic, allowing them to buy stocks on “sale.” The legend of Warren Buffett was built on this philosophy during the market turmoil of the mid-1970s.
There was more “blood in the streets” Monday as the world continued to digest S&P’s downgrade of U.S. debt, the two-week market selloff, and the likelihood the U.S. economy could possibly slide back into recession. These concerns, combined with continued political/economic struggles in the eurozone from socialist policies, have created a potent concoction of fear across global markets and sent volatility skyrocketing Monday to its highest level since the May 2010 “Flash Crash.” While many investors are running for the exits, others have chosen to ride the wave of volatility or buy depressed shares.
The S&P 500 Index has fallen 11 percent over the past three trading sessions. This has only happened fives times since 1960: The 1987 Crash, the Asian financial crisis in 1998 and twice in 2008, according to research from Desjardins. In each of these instances, markets gained an average 9 percent the following month.
The CBOE Volatility Index (VIX) rose more than 46 percent to break the key 40 level, signaling an extreme event, and is up over 164 percent for the year. In general, any time the VIX reads above 30 means conditions are volatile. Above 40, it’s clear the only thing at a premium in this market is fear.
The S&P 500 isn’t the only investment that’s been experiencing extremes. A flood of safe-haven buying sent gold prices up more than $50 an ounce (more than 3 percent) to $1,715.40 at market close Monday. Gold continued its climb early Tuesday morning, rising another $34 an ounce. Gold prices are up over 46 percent for the past year and roughly 13 percent the past 30 days. The increase over the past month is roughly equal to gold’s normal volatility over an entire year and is a short-term risk for a minor correction in a secular bull market.
Meanwhile, oil (along with oil-related equities) has been bludgeoned down to price levels not seen in a year—off almost 30 percent from April 2011 highs. Other commodities such as copper, wheat and cotton have also taken sizable haircuts over the past two weeks.
Such market turmoil creates a real challenge for investors who are in it for the long haul. Investors must control their emotional response and remain on the lookout for opportunities. Equity performance and fear-driven volatility carry a strong inverse correlation. This chart shows sharp spikes in the VIX trigger an autonomic selloff in the S&P 500. However, these selloffs have historically resulted in strong rebounds, thus providing an opportunity for clever investors who like to buy their summer clothes during a winter sale and their winter clothes during the summer.
Before Monday, the VIX closed above the 40 level five times since 1995, and in all but one occurrence the market was at higher levels just three months later. The exception is 2008, when the VIX passed 40 on its way to 90 and remained elevated for months during the worst financial crisis since the Great Depression.
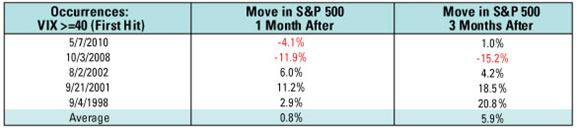
You can see from the table that the market has rebounded roughly 6 percent on average over the three-month period after hitting the 40 mark. Short-term reactions are more mixed. The market has swung 11 percent in either direction during the next month of trading and the average gain is only 80 basis points.
For the purposes of this exercise, the analysis is based on weekly data from August 8, 1995 through August 8, 2011. There were stretches of time, such as in 2008, when the VIX remained above 40, but we’re only counting the initial breach.
Market selloffs are actually common this time of year. According to the Stock Trader’s Almanac, August has been the second-worst month of the year for the Dow Jones and S&P 500 since the 1987 crash. The 7.2 percent decline for the S&P 500 last week was the worst week ever recorded during the month of August, beating out another dismal week for performance in 1974.
With this in mind, investors must remember there are some good opportunities out there and we’re working relentlessly to find them. Some of the best are in great American companies, whose balance sheets are the envy of Washington, with many carrying dividend yields above the 10-year Treasury bill. Currently, the 2.28 percent yield for the S&P 500 is the highest level since July 2009, Desjardins says.
A similar phenomenon took place following banking crises in France, Sweden and the U.S. during the 1990s. Without the ability to tap banks for additional capital, companies moved to large positive cash-flow positions and self-financed their growth, GaveKal research said in a note this morning. These strong capital structures provided the foundation for the market’s bull run during the back half of the decade.
This opportunity has largely been ignored as investors have fled like lemmings to the “safety” of cash, government bonds and money market funds. These investments “afford zero prospects for capital gains and only microscopic income,” says Murray Pollitt from Pollitt & Co.
This mad dash for cash is driven by fear and investor desperation to preserve their money rather than make any. Naysayers have been flippantly labeling gold a bubble since it reached $500 an ounce, but have turned a blind eye to the unprecedented amount of “money pouring into government bits of paper” that is the “biggest bubble of all time,” says Pollitt.
History is filled with cycles and each asset class carries its own DNA of volatility. Those who are highly leveraged or those forced to sell in order to raise capital are experiencing the most pain right now. Investors not in those two camps must remember that the markets are cyclical, just like the tide, which comes in and out each day, and the moon, which cycles every 29 days.
One area with potential is gold equities, which have lagged bullion significantly this year, pushing the gold-to-XAU ratio to the second-lowest level in nearly 30 years in June. Gold stocks also have a history of performing well when the U.S. economy hits a bump in the road. Depression-era babies might remember gold stocks’ strong performance during the 1930s.
This lag sets the stage for a possible strong rally in gold equities relative to bullion once mean reversion to historical levels kicks in, just like it has done time and time again. Desjardins notes that one current catalyst for a rebound in gold stocks is increased profitability from rising gold prices and decreased input costs due to oil’s 28 percent decline off of 2011 highs.
In addition, many quality gold companies are “paying investors to wait” by increasing dividend yield rates above those of money funds. This creates a cash incentive to hold shares of the company and allows investors to participate in rising earnings.
A key question for the global economy is: Who will lead a recovery in global markets? Where will growth come from?
With trillions of dollars in debt acting as a ball-and-chain for much of Europe, the U.S. and the rest of the developed world, must detoxify their balance sheets before hitting the ground running. On the other hand, emerging market economies carry low levels of debt and operate like a cash business, making them the final frontier for strong economic growth.
A key reason is emerging market governments have the long-term policies in place to facilitate growth of their economies. GaveKal points out it’s unlikely we’ll get a second dose of large stimulus like we did in 2008-2009 because of inflationary pressures, but that magnitude of assistance isn’t needed. Because China and other emerging market governments focused their stimulus on job creation and infrastructure development, their roads to economic growth have already been paved.
This will allow them to flex their economic muscles during short-term instability and insulate them from the turmoil. This is why we think emerging markets will continue to shine for many years to come.
Take China’s $300+ billion commitment to construct a nationwide high speed rail network, for example. The project is already paid for and will invigorate consumption across all sectors of the economy by connecting 700 million people across 250 cities. The recent accident was a terrible tragedy but the country is not going to abandon its plans. Rather, China will learn from the setback and push forward with better safety standards.
While the investment herd rushes into CDs and other “zero” yielding investments, nimble-minded investors can use these cycles to seize current opportunities and position portfolios for when the bull market tide returns.
Tune in to “Frank Talk” on Tuesday and Wednesday for second half 2011 previews of oil and copper.
U.S Global’s global market insights are now available “on the go” with mobile applications for the iPhone, Blackberry and iPad. Download the free apps today and access a whole new world of investing with the swipe of your finger. Download the apps.
By Frank Holmes
CEO and Chief Investment Officer
U.S. Global Investors
U.S. Global Investors, Inc. is an investment management firm specializing in gold, natural resources, emerging markets and global infrastructure opportunities around the world. The company, headquartered in San Antonio, Texas, manages 13 no-load mutual funds in the U.S. Global Investors fund family, as well as funds for international clients.
All opinions expressed and data provided are subject to change without notice. Some of these opinions may not be appropriate to every investor.
Standard deviation is a measure of the dispersion of a set of data from its mean. The more spread apart the data, the higher the deviation. Standard deviation is also known as historical volatility. All opinions expressed and data provided are subject to change without notice. Some of these opinions may not be appropriate to every investor. The S&P 500 Stock Index is a widely recognized capitalization-weighted index of 500 common stock prices in U.S. companies. The NYSE Arca Gold BUGS (Basket of Unhedged Gold Stocks) Index (HUI) is a modified equal dollar weighted index of companies involved in gold mining. The HUI Index was designed to provide significant exposure to near term movements in gold prices by including companies that do not hedge their gold production beyond 1.5 years. The MSCI Emerging Markets Index is a free float-adjusted market capitalization index that is designed to measure equity market performance in the global emerging markets. The U.S. Trade Weighted Dollar Index provides a general indication of the international value of the U.S. dollar.
Frank Holmes Archive |
© 2005-2022 http://www.MarketOracle.co.uk - The Market Oracle is a FREE Daily Financial Markets Analysis & Forecasting online publication.