The Complete Cost Of Mining Silver
Commodities / Gold & Silver Stocks Jul 31, 2011 - 08:45 AM GMTBy: Steve_St_Angelo
 The inspiration to write this post was to clarify some issues with the costs of mining silver. I believe many of the investing public has mistaken what is termed as the “CASH COST” as the real cost of mining silver. According to the Silver Institute in 2010, the cash cost from primary mine production was $5.27 an ounce. The Silver Institute gets their info from the World Silver Surveys produced by GFMS. I have had an email exchange over the past several months with one of their metal analysts on various topics. I recently asked permission to reproduce their Cash Cost graph for this post, and was told I could do so for $1,500.
Instead of forking out 1,500 clams for a graph that I believe is highly overrated, I decided to reproduce my own simpler version for this post. Let me point out, the 2010 silver cash cost posted on the Silver Institute comes from a percentage of primary silver producers. If global primary silver production was only 30%, the $5.27 an ounce cash cost was only a small part of the overall global cash cost picture. To understand what represents “CASH COSTS”, here is a good definition:
CASH COST: The costs of onsite production including by-product credits as well as transport, refining, onsite administration costs and royalties.
What isn’t included in the cash costs are depreciation, depletion, amortization, general and administration, exploration, interest expense, and taxes. This is not a complete list, but you get the idea. Furthermore, cash costs of silver represent measurements that are not in accordance with GAAP (General Accepted Accounting Principles) that management uses to evaluate the performance of mining operations. Why is that last sentence important? Even if you have a very low cash cost, it doesn’t guarantee profitability.
Let me give you an example. In 2008, Hecla had a silver cash cost of $4.20 oz. Even though the average price of silver in 2008 was $14.99 oz, Hecla had a Net Income loss of $66.5 million. We can see that the cash cost in reference to the profitability of a company is completely worthless. That is why I have come up with my own formula on what are the COMPLETE MINING COSTS for silver.
Investors need to realize that all costs should be factored into calculating what a company actually pays for bringing an ounce of silver to market. In each ounce of silver that a mine produces and sells to market a portion must go towards exploration, general administration staff, interest expense, depreciation and etc….we also can’t forget the costs in mine remediation when the operation is finished. To me, it doesn’t matter what a mine’s cash costs are if they can’t make a profit. The industry has highly publicized the cash costs of mining companies which in my opinion has misled the investing public.

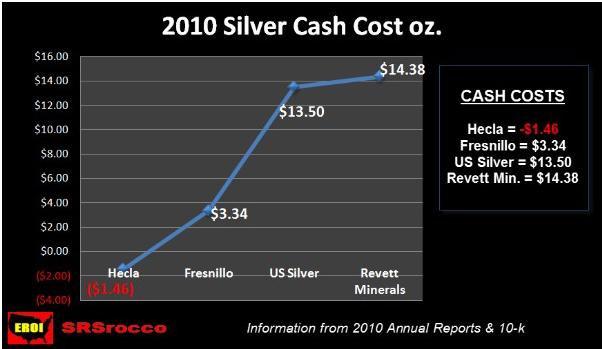
This is my version of a cash cost graph. I have been focusing on U.S silver companies, but wanted to throw in Fresnillo as a comparison. Fresnillo located in Mexico, is the largest primary silver mine in the world with 38.5 million ounces of silver produced in 2010. Hecla has mines in Idaho and Alaska. US Silver’s Galena mine is located in Idaho and Revett Mineral’s Troy mine is located in Montana. I did not include Coeur d’ Alene, even though it is the largest U.S. based primary silver mine in the country. Most of Coeur’s silver production comes from Mexico, Bolivia and Argentina. I wanted to stick with the largest domestically producing primary silver mines in my report.
As you can see from the graph above there is a range from Hecla’s negative cash cost of -$1.46 oz to Revett Mineral’s cash cost of $14.38 oz. Basically, Hecla is mining silver for free when you factor in all their by-product credits from gold, lead and zinc. Now that you know the cash costs of these companies, let’s look at my formula for calculating the COMPLETE COST OF MINING SILVER.
CALCULATING MY COMPLETE COST PER OUNCE
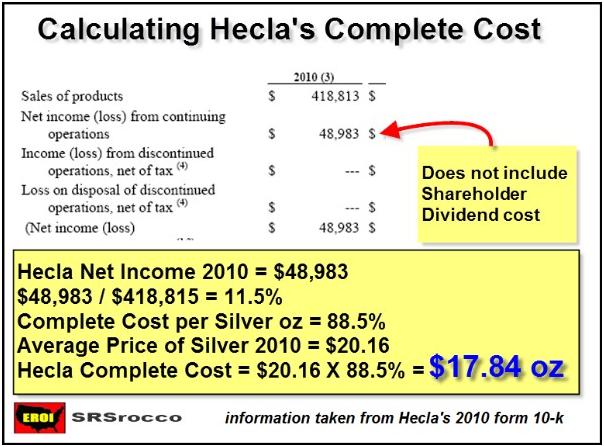
To get a more complete cost of mining silver, I took the net income at end of the year from each mining company and divided it by their total sales. This turns out to be a percent. That percentage figure is subtracted from 100% and then multiplied by the average price of silver in 2010…which was $20.16 oz. Again, this is a formula I came up with does not factor in the sales of silver vs. silver production as well as other items including differentiation of by-product credits between different mining firms. I believe that most by-product metal sales from the majority of mining companies’ are sold at market value or similar in price to their competition. As you can see there are so many variables, but at least my method gives the investor a better idea of how much it really costs a mining company to profitably produce silver. Here is an example below:

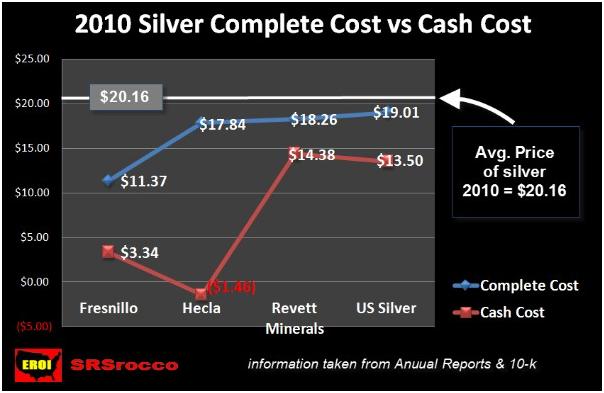
As I mentioned above, I did not use what is termed as “Income applicable to common shareholders”, which in Hecla’s case was $35.3 million in 2010 ($13.6 million in dividends). Some mining companies have dividends and some do not. To make it simple and easy across the board, I used the Net Income from each mining company. I plugged in the formula above for each mining company and came up with the COMPLETE COST GRAPH below:

Here we can see there is quite a difference between the mining companies’ cash cost per ounce and what the complete cost per ounce after everything is paid (except shareholder dividends). Even though Hecla had such a low cash cost in 2010 (due to a great deal of by-product credits of gold-lead-zinc), its complete cost per ounce was $17.84 using my formula. When someone asks me how much it cost for Hecla to produce an ounce of silver in 2010….it’s closer to $17.84 than it is to -$1.46. If the average price of silver had fallen below $17.84 an ounce in 2010 and each mining companies’ production costs remained the same, Hecla, Revett Minerals and US Silver would all have shown losses instead of profits. Fresnillo had a much larger margin due to its huge volume of high grade silver production that it could have absorbed much lower silver prices.
There seems to be a correlation between production volume and cost. The more volume, the lower the complete cost. If many of the silver bears had their way and the price of silver remained below an average of $15 an ounce in 2010, mining companies can’t stay in business giving away silver at a loss. This is the same situation in the oil business. Tar Sands at a production expense of $80+ a barrel cost a great deal more to produce than Saudi oil at $20 a barrel (in 2007 dollars). If the price of oil falls below $80 and stays there for quite some time, Canadian Tar Sands would be one of the first operations to cease production. Price destruction = Supply destruction. Below are the silver production figures for the 4 mines used in my graphs:
2010 SILVER PRODUCTION FIGURES
Fresnillo = 35.8 million oz
Hecla = 10.5 million oz
US Silver = 2.3 million oz
Revett Minerals = 1.0 million oz
Three of the four primary silver mines listed above are located in the U.S. which accounted for 36% of total domestic silver production in 2010. Again, if the average price of silver remained below $17.50 an ounce in 2010, three U.S. silver miners would more than likely have suffered losses rather than profits.
I hope this gives the investor a better idea of complete costs of mining silver. For all of you who think that it costs more to mine silver in the U.S. than it does in Mexico and South America….I give you Coeur ‘d Alene. In 2010, the majority of Coeur’s silver production came from Mexico, Argentina and Bolivia. In 2010, Coeur ‘d Alene had a net income of -$91.3 million. That’s right a negative 91.3 million clams.
DISCLAIMER & FINAL THOUGHTS
Any of you who think you can take my complete cost figures and try to tell others that so and so mining companies’ cash costs are bogus, need to read my disclaimer. My formula above is a common sense approach to finding out what a “next to best complete cost” to mine an ounce of silver for each mining company. It is not a precise science. There are a lot of variables that are not included. What it is…is a guideline to show a complete cost picture rather than what the industry touts as CASH COSTS….which to me are totally meaningless.
That being said…..I plan on doing a 2011 Q1 update to show that even though complete costs are rising, profits are rising even faster. For example, using my formula Hecla had an increase of a complete cost per ounce of $21.59 for silver in Q1 2011 compared to $17.84 in 2010. With the average price of silver in Q1 being $31.66, Hecla has more than a $10 net profit per ounce….or a whopping 31.8% net return after all costs compared to only 11.5% in all of 2010.
One of the reasons why I write these posts is due to what I refer to as ANAL-ISTS rubbish. This is what I term as ANALYSTS gone bad. There are several of these on my list. I will come out in this post and say that Ned Schmidt has been one of my favorites on this list. Ned put together a chart on what he thought was a FAIR VALUE for silver. I might reproduce his chart in a future post when I feel like presenting “THE OTHER SIDE OF THE STORY”. Ned Schmidt gave a fair value of silver in JAN-FEB 2011 of $15.42 an ounce. He also stated that it was OVERVALUED at $20.04.
I believe I proved that if silver was anywhere near $15 an ounce, several mining companies would have suffered big losses. I sometimes wonder the motivation of so called gold and silver analysts who offer such splendid advice and forecasts.
Lastly…I mostly enjoy writing these posts to help educate others. I believe a better informed investor makes better decisions. Because these posts take a great deal of time to put together, I would really enjoy seeing your comments…either pro or con. I imagine a great deal of the readers may never leave a comment…but I would just like to know if this work has had some benefit to the reader.
Steve St .Angelo Independent researcher residing in southwest Utah
Contact sst.angelo@gmail.com
© 2011 Copyright Steve St .Angelo - All Rights Reserved Disclaimer: The above is a matter of opinion provided for general information purposes only and is not intended as investment advice. Information and analysis above are derived from sources and utilising methods believed to be reliable, but we cannot accept responsibility for any losses you may incur as a result of this analysis. Individuals should consult with their personal financial advisors.
© 2005-2022 http://www.MarketOracle.co.uk - The Market Oracle is a FREE Daily Financial Markets Analysis & Forecasting online publication.


