


Stock Market Crazy Week, Here We Go Again
Stock-Markets / Stock Markets 2011 Jul 31, 2011 - 08:21 AM GMT

 Another crazy week, and although we have not gone anywhere, as we are still stuck in the same range we have been for weeks.
However the market did put in a in a bull trap that we were suspicious off, I posted this to members last week in my weekend report.
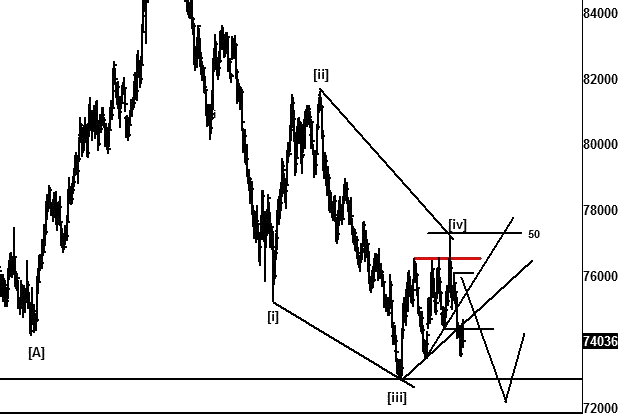
"As per the SPX idea, if a 3rd wave is working now, we really don't want to hanging around, we need to see an aggressive upside move, if we lose 33ES that's a caution to the bulls, under 29ES can suggest either see 1285ES and a lower target for wave E.
Or the wave E can be a triangle itself and we potentially continue a triangle sideways, but for now let's focus on 33ES and 29ES, under 33ES is weaker than I would want to see, it held on Friday, so ideally need a rally and gap up on Sunday/Monday.
So far only 3 waves, so potentially a b wave if no follow through here and reverses back under 33ES.
I will keep everyone updated, so don't worry if you're confused, under 33ES is a sell short term.
If you look closely on the FTSE and DAX and SPX, we possibly only have 3 waves to the upside from last week's move, so there is a chance of a b wave high and we reverse hard to the downside, for that idea I expect to see puking under 33ES, then see other market's like AUD/USD puke and USD/CAD get aggressive to the upside.
So watch for a potential bull trap loosing 33ES and seeing heavy downside price action is near term not good for the bulls, and I am using 33ES for an edge.
The DAX to stall out near 7350 can be only a 3 wave move, the same as the SPX if stalls out near its highs made last week around 1345SPX, so let's watch for any weakness in risk markets.
If a 3rd wave, this really should not hang about and rally hard from Monday.
Rumor's of sorts of stuff going around about stock markets crashes and if the deal on the US debt don't get done etc.
We won't know what the markets are going to do until it opens, that much we do know, however under 33ES is a sell, so we sell 1st think about patterns later, next support is 29ES, but staying under 33ES then 29ES is a sell".
ES
The market's inability to move away from the 33ES area was an issue; that area had been an important area for us over the last few weeks, and we knew that if the market could not hold that 33ES area, it was going to cause a problem for any bullish idea of going higher.
Seeing 33ES lost was a problem for the bulls, earlier in the week globex was looking like a triangle, and the market's inability to stay above 33ES, was suggesting this was the likely path going forward with a bearish bias staying under 33ES and especially under 29ES, we knew that under 33ES was a sell, it was a case of sell 1st look at patterns 2nd.
Traders should never have an issue with respecting what price does, after all "price is all that matters".
That's something I am true believer in, price rules and always will do, by having an idea, you are one step in front of the next trader that is not focused and does not have a trading plan, whilst we were bullish above 33ES, the very fact we gapped down in globex on Sunday was an issue, as we traded as low as 22ES.
So that was a caution, but we then wanted a back test to get short, what happened is that it kept gyrating around 33ES and was causing all sorts of issues, but then the pattern started to materialize, once I had an idea, we then knew how we could play it.

Seeing the globex session gyrate in Europe around the 33ES was a starting to look bearish, but we still needed to get under it solidly, well finally, it cracked and what a way it went, we knew our risk was to 39ES, but the downside potential was at least to 1312-15ES or lower targets of 1306ES and 1285ES.
Sheessshhhhhhhh little did I think we would see 1285ES so soon but it was nailed eventually and job well done.

The bulls are not dead and buried, just as they were not dead and buried at the mid June lows. Whilst this area of support holds, the bullish idea of seeing higher needs respecting, those that don't respect this area in the ES may just find themselves on the end of a powerful rally like we saw back in mid June 2011 for 90 handles. There is a right time and wrong time to buy and sell, and caution imo should be used, this area is a war zone and the victor will likely see a substantial move, either way we don't care, as long as we can get on the trend.

If the market wants to crack lower and lose this support area, then traders need to follow that lower and sell it once it confirms and breaks lower support.
Readers of my past articles will note that I have and still remain bullish, I was bullish going into the lows made near 1260SPX as the world was crying crashes, and of course with too many shorts, we saw a forced short covering rally of 90ES handles, in one of the quickest rallies on record.
I wonder how many saw that coming?
Not many, judging by the speed the bears were covering.
Now we are near to those areas again, and it's like that 90 handle rally never happened, I mean traders now want to start thinking about getting short at the lows again? Are they serious?
Was it not a better place to get short at the highs at resistance? I.e. 33ES or even 16ES, or at any of our #s
I guess, you need 60 handles of downside to get bearish, and 90 handles of upside to get bullish :-)
It's the same every time traders are bearish at the lows when you want to be thinking about buying and bullish at the highs when you really want to be thinking about selling, and you wonder why traders are getting taken to the cleaners in this market.
When you look at the range this past year, it's just been one great big triangle shape, and we are stuck in a huge range, and still not confirmed that the market has indeed turned bearish.
Now whilst those bullish patterns are in play and potentially viable, we should respect those.
Can this market crack lower? Sure it can and it could see a water fall type move, but I am not in the business of forecasting crashes or bull markets to SPX 2000, I will let price prove an idea wrong or right.
So where and what are we potentially doing now??
The bullish triangle idea is still valid, it does not technically get invalidated until 1258SPX, but I really want to see some support hold around the 1280SPX area, we tested our target areas on Friday, and hit the 1285ES area, but with the US debt issue overhanging the markets, it's up in the air if the low is on for the pattern, although I am open to ideas of seeing lower, if the market cant rally from here, I think we 1st really need to see how price responds to these areas, if the bulls can't get the upside going as will be needed and get over some key resistance areas, then the bears will get the advantage, and sellers will likely take control.
Then traders need to become sellers, as if the bulls can't deliver, there is little point buying a market if it looks like it's going to really see heavy selling, so next week will be important for bulls and bears.
We know what needs to happen, and the bulls need to "show us da money" or they are going to be trouble.
I don't have any issues flipping and getting aggressive short this market, sheeshhh we have practically been short this week from 33ES into Fridays low. So jumping back on the short side is not going to be a problem for us, however if a substantial low is near, it can be a move that is going to hurt any "late to the party bears" that now want to sell after a 60 handle move.
EUR/USD
Nothing really much changed from my last article, as the Bullish ED idea is still valid, DX has a valid ED idea as its virtually the opposite to the EUR/USD pair , this past week has seen markets continue to whipsaw around.
DX idea.
Still looking for the new low in this ED idea on the DX, that should see the EUR/USD push higher towards 150-152, however we do have a level in the EUR/USD that if broken on the downside, would really startto see issues on the bullish idea.

So whilst these ideas still stand, they are the primary ideas going forward.
Conclusion
The week was the complete opposite to the prior week when the bulls were in control, so around 70% taken back off the prior rally that started in mid June 2011, whilst this market can crack lower and see some substantial problems, there is a setup for the bulls as long as 1258SPX holds, although I would prefer not to get that close to those lows, then the bulls have to "show us da money" and buy aggressively or they face losing the support areas we are currently vibrating.
Failure to hold these levels is a big issue for the bulls, as the market can be setting up for a substantial downside move.
Bulls need to deliver or they can be in real trouble fast, it should be a good week, 90-60 handle moves in a few days are great conditions and great for nimble traders that are prepared to jump on the move and ignore the news and just follow what price is doing.
Until next time. Have a profitable week ahead.
Announcement
This week marks the 1 year anniversary of the start of Wavepatterntraders.com and as a token gesture to readers, this week starting from 12 midday EST Sunday 31st Jul till 5th August Friday 6pm EST, guests can get access to my work, and see examples as we go through this week, as I cover in many markets. With the way the markets are setup, I think this week should offer some great setups, over the coming week.
So if you thinking about joining or want to have a better look at my work and interested to see if my work can help your trading, now is the time to make use, it's essentially a "free week".
Yes for the week, guests will have access to most of the site, some areas will be keep for private members, such as the chat room and daily commentary, but most of the site will be open, where guests can view the markets we follow markets, ranging from US and European stock markets, commodities & Forex.
So from Sunday 12pm, click on this link and it will take you to the site and I hope you enjoy what we have to offer.
http://www.wavepatterntraders.com/
So you really do have nothing to lose, as this week is going to be free to view my work.
Please feel free to pass that information on to friends and trader colleagues.
Please feel free to pass that information on to friends and trader colleagues..
Click here to become a member
You can also follow us on twitter
What do we offer?
Short and long term analysis on US and European markets, various major FX pairs, commodities from Gold and silver to markets like natural gas.
Daily analysis on where I think the market is going with key support and resistance areas, we move and adjust as the market adjusts.
A chat room where members can discuss ideas with me or other members.
Members get to know who is moving the markets in the S&P pits*
*I have permission to post comments from the audio I hear from the S&P pits.
If you looking for quality analysis from someone that actually looks at multiple charts and works hard at providing members information to stay on the right side of the trends and making $$$, why not give the site a trial.
If any of the readers want to see this article in a PDF format.
Please send an e-mail to Enquires@wavepatterntraders.com
Please put in the header PDF, or make it known that you want to be added to the mailing list for any future articles.
Or if you have any questions about becoming a member, please use the email address above.
If you like what you see, or want to see more of my work, then please sign up for the 4 week trial.
This article is just a small portion of the markets I follow.
I cover many markets, from FX to US equities, right the way through to commodities.
If I have the data I am more than willing to offer requests to members.
Currently new members can sign up for a 4 week free trial to test drive the site, and see if my work can help in your trading and if it meets your requirements.
If you don't like what you see, then drop me an email within the 1st 4 weeks from when you join, and ask for a no questions refund.
You simply have nothing to lose.
By Jason Soni AKA Nouf
© 2011 Copyright Jason Soni AKA Nouf - All Rights Reserved
Disclaimer: The above is a matter of opinion provided for general information purposes only and is not intended as investment advice. Information and analysis above are derived from sources and utilising methods believed to be reliable, but we cannot accept responsibility for any losses you may incur as a result of this analysis. Individuals should consult with their personal financial advisors.
© 2005-2022 http://www.MarketOracle.co.uk - The Market Oracle is a FREE Daily Financial Markets Analysis & Forecasting online publication.