


U.S. Q2 GDP The Numbers Don't Add Up
Economics / Economic Statistics Jul 31, 2011 - 03:43 AM GMTBy: Tony_Pallotta

 Q1 2011 GDP was revised one final time from 1.9% to 0.4% and Q2 2011 GDP the first estimate was 1.3%. Before analyzing the data I have one very simple question.
Economic growth slowed during Q2 as acknowledged by the Fed and indicated by regional Fed surveys, ISM, durable goods, etc so how could Q2 GDP be higher than Q1 GDP? That would imply the economy accelerated and clearly that has not happened. In other words just as Q1 2008 was eventually shown as the start of the great recession so will Q2 2011 in subsequent revisions.
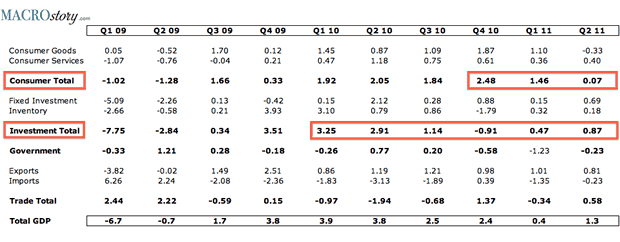
The table below shows how each of the four components contributed to GDP while the two red highlighted areas indicate the most vulnerable and their negative trend.
GDP = Consumer + Investment + Government + Net Trade
Consumer
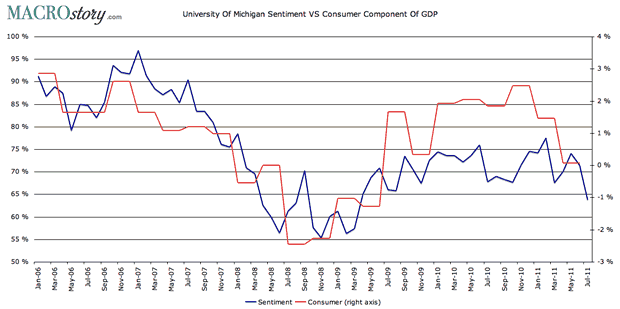
Representing upwards of 70% of the US economy the consumer fell hard from Q1 to Q2 with their contribution to GDP falling from 1.46% to 0.07%. This was driven primarily by contraction in consumer goods from 1.10% in Q1 to (0.33%) in Q2. The chart below shows further consumer weakness based on recent UM Sentiment survey data.
Additionally as more unemployed exhaust jobless benefits and the Federal government is less able to extend aid the consumer faces yet another major headwind.
Investment
Two components make up this category (a) Fixed Investment and (b) Inventory. As the great recession ended retailers began replenishing their stock rooms and adding inventory thus fueling economic growth but as the table above shows that build is coming to an end. As consumers pullback retailers will also pullback and rather than add to inventory will sell existing inventory.
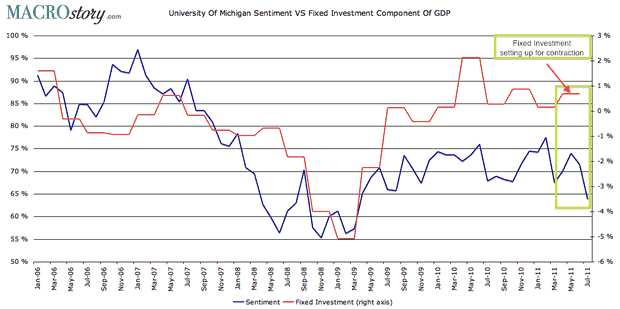
The fixed investment component appears to be either overstated or ready for a serious move lower. The historical comparison with fixed investment and UM Sentiment is presented below while the simple reality is if the consumer is pulling back so will the demand for fixed investment.
Government
The government component seems overstated in the current report at (.23%) after contracting (1.23%) in Q1. July 1 was the start of a new fiscal year for most US states and as required by law they were forced to balance their budget gaps. Reports had put the cumulative budget gaps in excess of $200 billion which in a $14 trillion economy is about 1.4% of GDP alone.
As housing prices continue to fall and foreclosures rise governments will see tax revenues decline and thus the need to cut spending further.
Net Trade
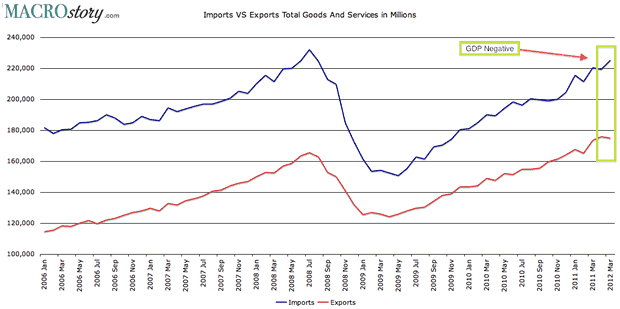
In Q1 trade was a source of contraction at (0.34%) and then in Q2 shown to add to GDP growth by 0.58% yet the trade data through May does not support this. Simply following the math outlined below the net trade component of Q2 GDP is trending negative and thus a source of contraction not growth as initially reported. Additionally China reported a record trade surplus in May.
March trade deficit was $46.8 billion
April trade deficit was $43.7 billion which is a net positive to Q2 GDP by $3.1 billion through April.
May trade deficit was $50.2 billion which is a net negative to Q2 GDP by $6.5 billion for the month and a cumulative net negative to Q2 GDP by $3.4 billion through May.
"Fool me once shame on you, fool me twice shame on me."
Don't be fooled by the state of the US economy. In reality we never left recession but regardless we are clearly back and the data points to anything but a soft patch. This report and the Q1 revision was truly horrible. In my view it shows the US far more vulnerable to a prolonged period of contraction versus a Japanese style period of rolling recessions.
By Tony Pallotta
Bio: A Boston native, I now live in Denver, Colorado with my wife and two little girls. I trade for a living and primarily focus on options. I love selling theta and vega and taking the other side of a trade. I have a solid technical analysis background but much prefer the macro trade. Being able to combine both skills and an understanding of my "emotional capital" has helped me in my career.
© 2011 Copyright Tony Pallotta - Disclaimer: The above is a matter of opinion provided for general information purposes only and is not intended as investment advice. Information and analysis above are derived from sources and utilising methods believed to be reliable, but we cannot accept responsibility for any losses you may incur as a result of this analysis. Individuals should consult with their personal financial advisors.
© 2005-2022 http://www.MarketOracle.co.uk - The Market Oracle is a FREE Daily Financial Markets Analysis & Forecasting online publication.