


Stock Market Panic Selling, What Does It Mean?
Stock-Markets / Stock Markets 2011 Jul 28, 2011 - 04:28 AM GMTBy: Chris_Vermeulen

 It was an exciting trading session Wednesday to say the least… With all the uncertainty floating around it is causing the stock market to be more volatile than normal. It seems like every other day there is some big headline news causing either strong buying of stocks or strong selling to take place. It’s this type of price action which spooks the average investor causing them to panic out of positions at key support areas just before a continued move higher.
I like to focus on the market when I see extreme buying or selling taking place. During times of extreme buying or selling in equities, investors are reacting on emotions rather than logic and that’s when I benefit from everyone rushing to the door trying to get rid of their positions at any price they can get.
Let’s take a look at what the market is telling us right now…
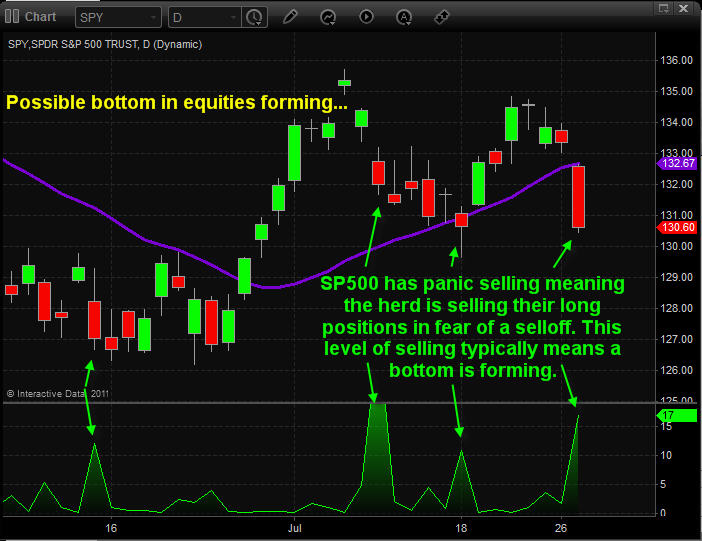
SPY – SP500 Index Exchange Traded Fund – Daily Chart
In this chart you can see my custom green indicator at the bottom. I use this to measure fear in the market. When this indicator is trading above 5 I know the masses are unloading stocks as quick as they can in pure fear that a market collapse is about to take place. But the biggest thing I learned trading over the past 12 years is that when everyone is doing something its best to skip the trade or start looking for technical setups which will get you in against the masses because the move is generally almost over.
What I get from this chart below is:
- The trend is still up
- We have not broken the previous pivot low from last week
- The market is showing extreme panic selling and I anticipate some type of bounce or bottom shortly.
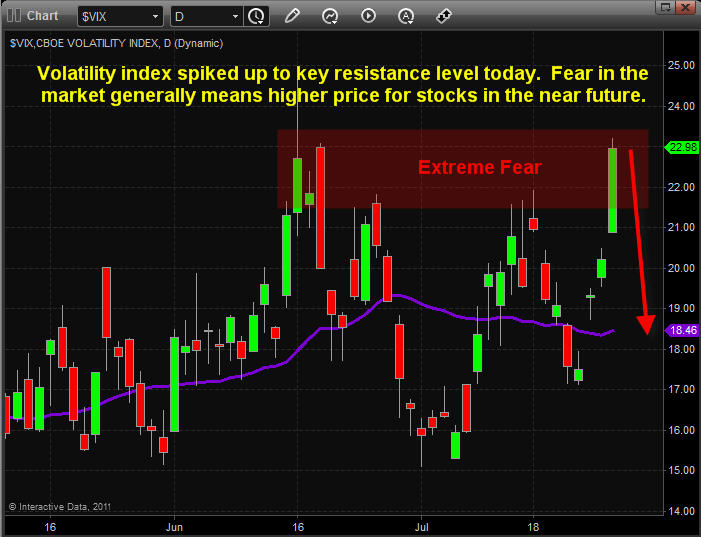
VIX – Volatility Index – Daily Chart
The volatility index measures fear in the market. So with the vix spiking up into a key resistance level, I would not be surprised to see it go a little higher then sharply reverse back down.
Trading off fear and greed can be very profitable but you must understand the two. Greed is a slow driving force in the financial market. As prices rise day after day the greedy continue to buy more and if they see any sharp dip they just look at it as an opportunity to buy even more (even though its a sign of smart money distribution selling) until eventually there is a huge collapse from the big money players unloading their positions and the greedy are left holding the back with a higher cost average price. This is the reason market tops tend to take 3-7 times longer to form than market bottoms.
Fear on the other hand is very quick. Think of it as if you were walking through your house at night down a dark hallway. When all of a sudden your friend jumps out and screams catching you completely off guard. What do you do? You jump, most likely yell and drop everything you were doing, then 30 seconds later you are back to normal. Well this is what happens in the stocks market also...
Traders hold their positions until a piece of news hits the wires or there is a strong selling day and their investments start falling quickly. This sudden news or price movement which they were not anticipating causes traders to panic and sell everything before the investment collapses. Typically a couple days later the price rebounds and after a strong bounce these traders decide to buy back their position and ride the price to new highs. So what if you were to get in near the bottom then let all the traders bought back after you? It generally means big money for you. This is what I look for and what I consider panic selling to be.
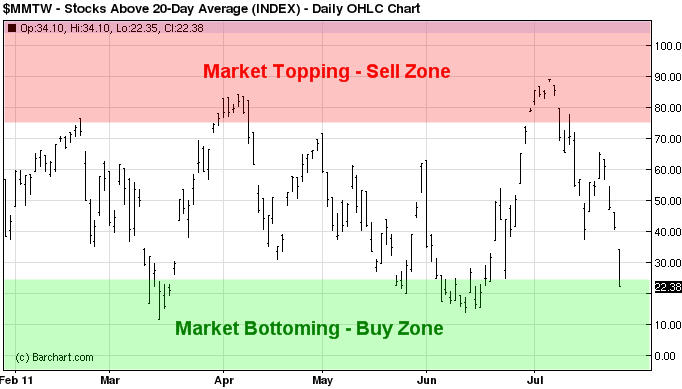
Stocks Showing Signs of Being Oversold
This chart below shows the percentage of stocks trading above the 20 day moving average. Over time I have found that when 75% or more of stocks are trading above their 20MA then the market is getting overbought and one should be looking to tighten stops, take partial profits and or look for short setups.
On the flip side when only 25% stocks are trading above the 20 day moving average I find the market usually puts in a bounce or rally which lasts several weeks.
As you can see in this chart after Wednesday’s sharp move lower we are now entering into an oversold market condition. I expect volatile prices for a few days as the market stabilizes then a move to the upside.
Mid-Week Trend Conclusion:
In short, I feel we are in for some choppy price action over the next 2-10 sessions. With the current market trends I do feel that the odds are pointing to higher prices for both stocks and commodities.
If you would like to get more of my daily analysis to join my newsletter at www.GoldAndOilGuy.com
By Chris Vermeulen
Chris@TheGoldAndOilGuy.com
Please visit my website for more information. http://www.TheGoldAndOilGuy.com
Chris Vermeulen is Founder of the popular trading site TheGoldAndOilGuy.com. There he shares his highly successful, low-risk trading method. For 6 years Chris has been a leader in teaching others to skillfully trade in gold, oil, and silver in both bull and bear markets. Subscribers to his service depend on Chris' uniquely consistent investment opportunities that carry exceptionally low risk and high return.
This article is intended solely for information purposes. The opinions are those of the author only. Please conduct further research and consult your financial advisor before making any investment/trading decision. No responsibility can be accepted for losses that may result as a consequence of trading on the basis of this analysis.
© 2005-2022 http://www.MarketOracle.co.uk - The Market Oracle is a FREE Daily Financial Markets Analysis & Forecasting online publication.