


Gold Stocks Historic Move Directly Ahead
Commodities / Gold & Silver Stocks Jul 25, 2011 - 01:18 PM GMTBy: Jordan_Roy_Byrne

 A variety of factors are lining up that lead us to believe we are on the cusp of a major move higher in the gold stocks. We feel we have been saying this for a while but the reality is we are moving closer and closer to that moment. The fundamentals couldn’t be more obvious and being in the 11th year of a bull market means the timing is ripe. We think you will find the facts and conclusions extracted from the technicals, sentiment, and valuations very compelling.
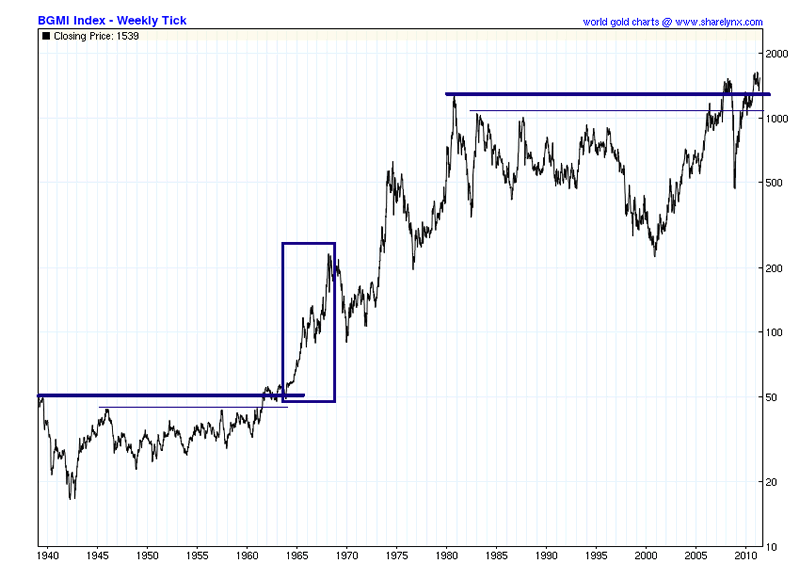
First lets look at the technical aspect with the BarronsGoldMiningIndex. Gold Stocks basically consolidated from about 1937 to 1961. The breakout really began in 1964. The consolidation ranged from about 17 to 50. The breakout took the market from 50 to about 220 and in only four years. Today we are on the cusp of a similar breakout. The market made a marginal high in 2008 and another marginal high earlier this year. A sustained move to new highs will qualify as a major multi-decade breakout.
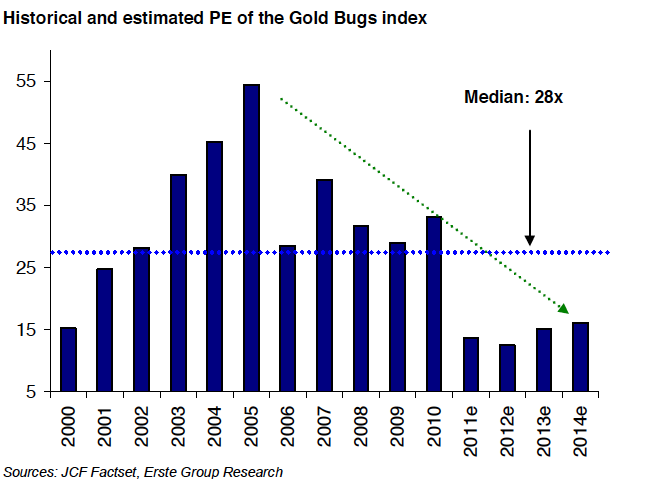
This breakout will come at a time when the gold stocks are trading at a historical discount. The chart from Erste Group Research below shows the historical and estimated future price to earnings (PE) ratio for the companies in the HUI Gold Bugs Index. As of now, the gold stocks are trading at their lowest PE ratio in the past 11 years. That is ironic considering we are in the second decade of a bull market. In an interview with KingWorldNews, legendary mining executive Pierre Lassonde said the gold stocks, in terms of valuation are probably trading at a 10-20 year low. Obviously, there is plenty of room for valuation expansion.
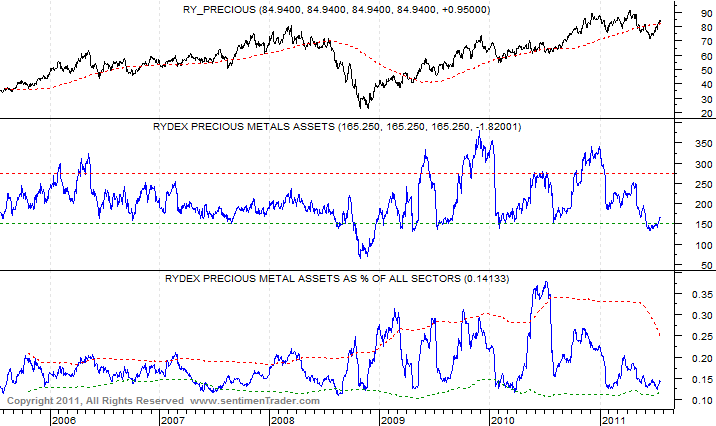
Furthermore, the gold stocks are hardly a popular sector. The data from Rydex’ Precious Metals Fund (courtesyofSentimenTrader.com) shows that the sector is underowned in both nominal and real terms. Assets in the fund are just gaining from a two-year low and as a percentage of all sectors, assets are only 14% which is also near a major low.
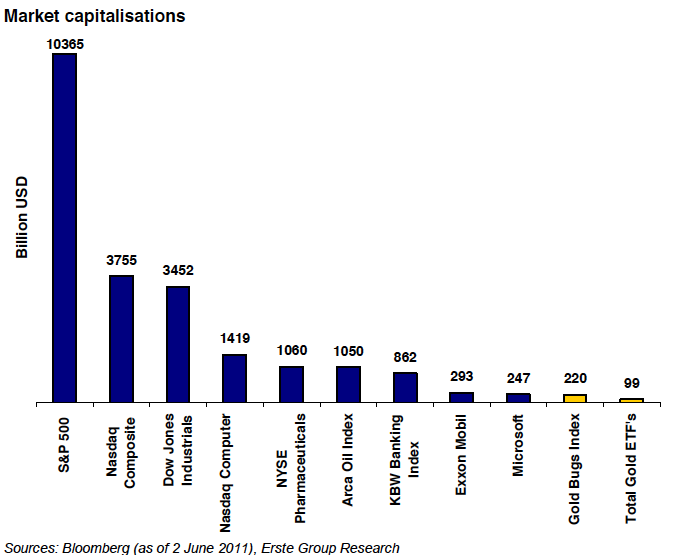
Moreover, the size of the gold stocks relative to the market is almost akin to a needle in a haystack. The next chart is another great one from the Erste Group. The S&P 500 has a market cap of $10.3 Trillion. The market cap of the HUI, at $220 Billion is only 2% of that. It’s less than Microsoft and Exxon Mobil.
The gold stocks are ready for a massive, potentially historic breakout and it comes at a time when the sector is underowned, undervalued and a tiny fraction of the overall market. Put it all together and your conclusion should be obvious unless you’ve been conditioned (as sadly many have been) to only focus on conventional asset classes
If you’d like to learn more about how to profit, manage risk and have a professional guide you, then you can learn more about our service here.
Good Luck!
Jordan Roy-Byrne, CMT
Trendsman@Trendsman.com
Subscription Service
Trendsman” is an affiliate member of the Market Technicians Association (MTA) and is enrolled in their CMT Program, which certifies professionals in the field of technical analysis. He will be taking the final exam in Spring 07. Trendsman focuses on technical analysis but analyzes fundamentals and investor psychology in tandem with the charts. He credits his success to an immense love of the markets and an insatiable thirst for knowledge and profits.
© 2005-2022 http://www.MarketOracle.co.uk - The Market Oracle is a FREE Daily Financial Markets Analysis & Forecasting online publication.