Stock Market Major Top and Gold Breakout Targets $1750
Stock-Markets / Financial Markets 2011 Jul 24, 2011 - 06:31 AM GMTBy: J_W_Jones
 Recently I have had several members of my service requesting my thoughts on the macroeconomic backdrop which is shaping financial markets. I decided I would proffer an article about why I find such practice to be a total waste of time. Don’t get me wrong, acknowledging what is going on in the world around us as a trader is important because economic data and geopolitical events shape social mood. Social mood is just one catalyst that directly impacts financial markets and it is important for traders to monitor the world around them.
However, building trading plans based on events with outcomes that are unknown and unknowable is foolish. If an event’s outcome is unknown, one would surmise that the market’s reaction to the news is unknown as well. If a trading plan is built on multiple unknowns it can lead to a disastrous outcome for trades built around such premises. I pay attention to the headlines, but I don’t base trading decisions solely on the news cycle. Spending time building detailed thoughts about the future of events and then trading based on those events also cause traders to become biased with regard to price action.
Let me be clear, I do read analysis from experts on global events, but I don’t build trading plans around what I read. I try to look at the news and decipher what impact events will have on social mood. Once I have what I feel to be a grasp of social mood, then I look at fundamentals which could be earnings reports or economic data points searching for more clues about social mood and the strength of specific economies. From there, I use basic tape reading and technical analysis to help identify trades that have sound risk / reward. Trading is not a guessing game, nor is it gambling. The best traders take a variety of forms of data, interpret them, and then build trades that make sense based on probability.
Trading is very similar to playing poker. Everyone sits down with the same amount of money essentially and the money on the table does not really change. All that happens is money moves from one perception of the game to another. Those who understand and accept risk at appropriate times are rewarded more often than those who ignore risk. As time goes on, the players who understand the game and risk the most make the most money as their probability of success is higher than those who play every hand ignoring potential hazards. Trading is identical in thought and practice. Understanding risk and leveraging probability is what separates great traders from speculators.
As is customary, I will provide readers with a little bit of insight about what I believe could play out in the S&P 500 and gold. Before I get into the chart work, I would like to remind readers that this market is treacherous. Risk has not been this high for quite some time and ignoring it is foolhardy. I am trading smaller position sizes, taking profits quickly, and ultimately I’m sitting in cash waiting for price to breakout and offer solid setups where risk is defined. Currently the S&P 500 and gold are stuck between major overhead resistance and underlying support. Breakouts are going to transpire, but the question is which direction price will ultimately go. I’m going to let others do the heavy lifting and wait patiently for a solid setup to trade.
It seems to me that social mood is pretty poor at this point, economic data has not been great, earnings have been solid except for Caterpillar, and headline risks are plentiful. With that said, I am starting to lean slightly in the bullish camp. My reasoning is built around the fact that the majority of retail investors and novice traders are all setting up for a nasty selloff.
The only selloff I see possible is in the Treasury bond market and possibly the U.S. Dollar. In either case, equities could rally and it would be a surprise to most investors and traders. Mr. Market will punish as many traders and investors as possible and the majority are leaning bearish, so my contrarian instinct says to watch for bullish setups, but be patient enough to see them breakout before jumping aboard.
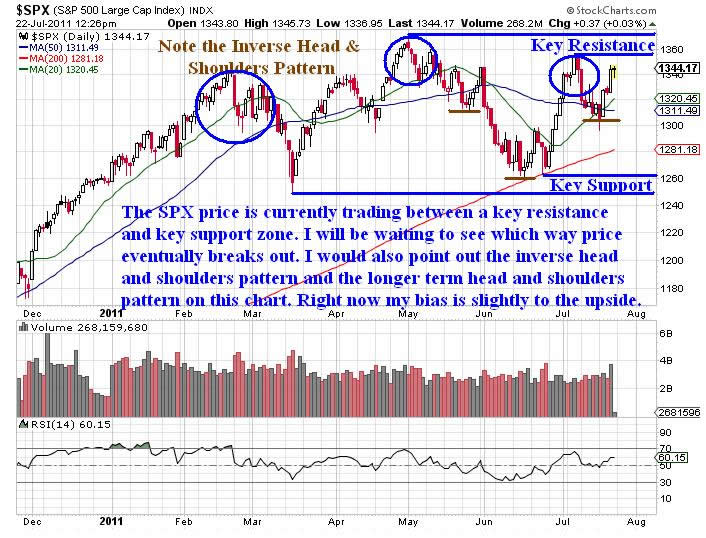
I intend to trade the S&P 500, but I am waiting on a confirmed breakout in either direction. I really don’t care which direction it is, I just want to be patient and let Mr. Market talk. Once I know the expected directional bias, I will have a solid risk / reward entry because I will be able to define risk at the breakout level regardless of which direction price ultimately arrives at. The key levels I’m watching on the S&P 500 Index are shown on the daily chart below:

If the S&P 500 extends to the upside above the S&P 1,350 price level a test of the 2011 highs will take place. I believe that if tested a second time we could see the 2011 highs taken out and a trip to the S&P 1,420 – 1,450 price levels before year end. Consequently, if price breaks down on the S&P 500 below the S&P 1,295 level I expect price to work down to the March pivot lows. If they breakdown, a trip to the S&P 1,150 – 1,180 area is likely.
Thus the conundrum described above is now in focus. The S&P 500 remains range bound and until a confirmed breakout takes place, I will likely remain neutral with a slight bias to the upside for good measure. However, I would point out I am simply going to be patient and let Mr. Market dictate the terms of price. I am just going to wait Mr. Market out instead of having some kind of trading plan built on assumptions about the outcome of multiple independent variables which at this point are unknown.
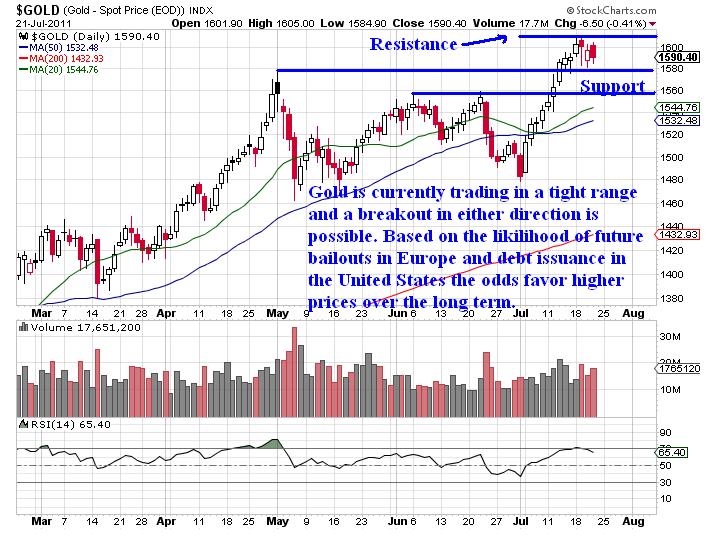
My most recent article discussed the likelihood for a small correction in gold and silver. We pulled back quite a bit, but news coming out of Europe and the flight to safety has bounced gold prices back near recent highs. I will likely establish new long positions in gold and silver on a breakout over recent highs that has strong momentum and volume. I continue to believe that in the longer term gold and silver will remain in a bull market due to the continuing devaluation of various currencies by deficit laden, overextended federal governments around the world. The daily chart of gold is shown below:

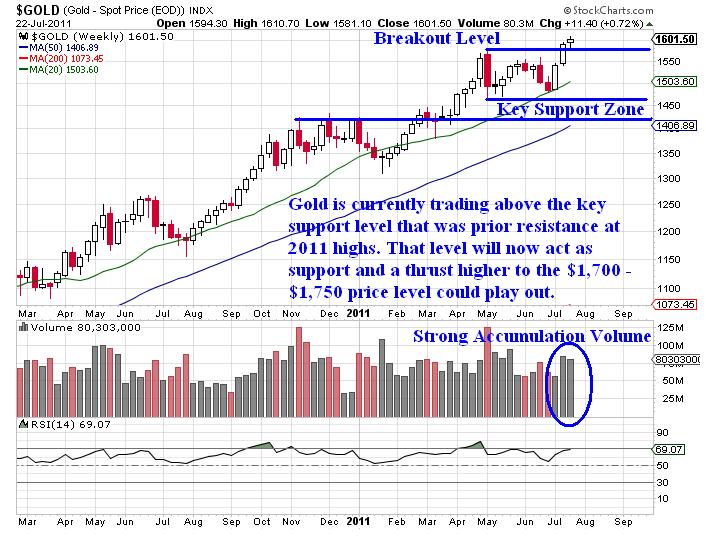
Gold similarly to the S&P 500 is trading in a range between the recent all-time highs and the breakout level which was offering resistance and now stands as support. If price breaks above the recent highs I will expect a move higher that could close in on $1,700 - $1,750/ounce by the end of the year. If price breaks below the recent breakout level (1,580) a thrust as low as $1,410 - $1,480/ounce could play out in a short period of time. I continue to believe higher prices are far more likely, but I will respect the price action. The weekly chart below of gold prices illustrates the key price levels:

In closing, I would remind readers to monitor their risk aggressively, keep position sizes small, and protect capital at all costs. Risk is extremely high currently and price could go either direction in a variety of asset classes.
This material should not be considered investment advice. J.W. Jones is not a registered investment advisor. Under no circumstances should any content from this article or the OptionsTradingSignals.com website be used or interpreted as a recommendation to buy or sell any type of security or commodity contract. This material is not a solicitation for a trading approach to financial markets. Any investment decisions must in all cases be made by the reader or by his or her registered investment advisor. This information is for educational purposes only.
Take a look at www.OptionsTradingSignals.com/specials/index.php today for a 24 hour 66% off coupon.
J.W. Jones is an independent options trader using multiple forms of analysis to guide his option trading strategies. Jones has an extensive background in portfolio analysis and analytics as well as risk analysis. J.W. strives to reach traders that are missing opportunities trading options and commits to writing content which is not only educational, but entertaining as well. Regular readers will develop the knowledge and skills to trade options competently over time. Jones focuses on writing spreads in situations where risk is clearly defined and high potential returns can be realized.
This article is intended solely for information purposes. The opinions are those of the author only. Please conduct further research and consult your financial advisor before making any investment/trading decision. No responsibility can be accepted for losses that may result as a consequence of trading on the basis of this analysis.
© 2005-2022 http://www.MarketOracle.co.uk - The Market Oracle is a FREE Daily Financial Markets Analysis & Forecasting online publication.


