


Stock Market Whipsaws Continue
Stock-Markets / Stock Markets 2011 Jul 23, 2011 - 03:39 PM GMT

 The markets continued with the whipsaw and wild swings that traders have being seeing for a number of weeks now, which are offering some great opportunities in all markets, be it equities, forex and commodities.
We are living in historic times with European nations that are on the brink of collapse and even the US is potentially looking at a default or a downgrade, should a deal not be on the table before the deadline of August 2nd 2011.
That aside, I have a feeling with have seen this movie before and the price action sure reminds me of 2008, with these crazy wild swings from nowhere on some rumors, kind of reminds me of those MBIA and AMBAC deals that were imminent, and around the corner, everyone remember those? regular as clock work on a Friday afternoon. They were famous for starting a short squeeze, which eventually came right back off.
Today we live in interesting times, 10 years ago you would never have dreamt of being so close to a technical default from the US, yet here we are with a real possibility, such is the bizzaro world we live in today.
That aside, the majority of the public, simply has not got a clue what's really occurring, if you talk the man on the street, he generally is only interested in where his next pay check is coming from, but rest assured, I think the markets are going to see some serious moves over the coming months, and feel that we are entering into a period like 2007-2008 again. We look forward to trading those moves, I think we got some great opportunities coming up, far far better than what we have seen already.
SPX
Last week, I left readers with an idea of a potential idea of a low in place, but we needed to hold last Fridays low, well that idea was blown out of the water, as we wanted a gap up on Monday, not a gap down, so we had to move to plan B and move to the target zone of 1290-1300SPX.
Members were aware of this target, it started off as my original target, but with a clear idea at last Fridays close, there was a good chance of a low in place, well as the market gapped down on Monday, we knew then to start looking for a low in the 1290-1300SPX region.
The low came in at 1296SPX, I also had a lower target of towards the 1280SPX, but overall I still felt the markets were trying to carve a low, simply based on the wave structure and not calling for a crash as some bears were for the umpteenth time, I guess when you call a crash at every given moment, then eventually you will be right.
A skilled Elliottician can with some confidence look at a chart and based on his/her skill and willingness to accept what price is suggesting and not some hardened bias, predict with some confidence the markets next likely move, and able to come up with control risk parameters, sadly I still see those perma bears (some even alleged to be the best in the business) still force labeling 3 wave corrective moves as impulsive 5 wave moves just to curve fit to a bias, generally when you "curve fit" wave structure to your bias, it 95% of time it proves you wrong. As has been the case for those bearish Elliottcians calling for the 3rd wave crash at every given moment because it corrects 50 points, the latest one being from the May 2011 highs. When you curve fit an obvious 3 wave move to become 5 wave move, imo you are asking for trouble trying to force a bearish bias on an obvious bullish tape, the trader and technician that is willing to adjust to the market and have a good feel for the gyrations, will come out on top.
If you are following such a service, have you not had enough with the poor service? are you not at a stage where you want to follow someone who actually knows how to count properly and willing to accept and switch ideas as price dictates, i.e. do their best to offer you a service that keeps you on the right side of the tape, and actually coming up with ideas to help you make $$$ in a multiple number of markets, even going so far as to suggesting not to trade a particular market or look elsewhere for a better opportunity, not trying to massage his ego with some wave count that is calling for the death of society as we know it.
Are you not fed up with so called experts forcing a wave count to fit their bearish bias, and cling on to ideas, even thought price is telling them that their ideas have been wrong for the umpteenth time.
If so I strongly suggest checking us out, you have nothing to lose my taking us up on the 4 week free trial offer.
My calls for a bullish move higher, have been met with some hostility, I guess being a lonely bull in this environment is not part of the "Ellioticians Clique", but I have gone it alone before and against the "so called experts" and will do again, as I am humble enough to acknowledge what price "is" likely suggesting against what it's "not" suggesting, that's the key to everything, understanding and making a judgment call based on what is happening against what is not happening and accepting that at times you can be wrong in your ideas.
So where are where likely going from here?
Well having hit our 1290-1300SPX target the market made a great start, but I made it known to members that we needed to get above 1310ES to be sure, as I not a fan of trying to catch tops or bottoms unless I can control risk with patterns like an ending diagonal (ED).
Tuesday resolved the issue and gapped over 1310ES and confirmed what I originally thought that a low was likely at hand.
You simply can't trade that sort of information from a newsletter, you have to adjust to the market in real time, that's why we have a chat room, and copy our transcripts for members in a daily forum, so even members that are working or don't have much time, and don't have access to the chat room, are keep up to date on a regular basis, having a newsletter update you "after" the move is as worth less as a chocolate teapot.
At WPT, we adjust as the markets adjust, members stay on top of patterns and ideas as the markets move, so it can work both ways, as it can limit risk if the idea is wrong and also we can try come up with ideas quickly, and not wait until after the idea has already finished, or stay flat (i.e. no trade) if we can't come up with a decent idea, if the market is choppy etc.
We think this adds superior value to most other services, in this sort of market, you need to be continuously on the ball with your analysis, and it's important that members of any service have complete access to ideas and up to date information, it's no good being charged a premium rate a minute to speak to someone about an idea, when you need to get in touch of the author quickly.
That's where we differ, as we trade and adjust as the market adjusts, so you get to stay on top of the markets, not wait 24 hrs or 48hrs till the next update.
My bullish call of new yearly highs is still on track and the market has not negated those ideas, the past few months has been in a sideways pattern and likely suggesting a move higher is near to happening if not already started. Those traders that have embraced the bullish side have made some terrific gains in these markets. Although I still get emails from time to me asking me when I will become bearish and what's my targets are etc, I guess some traders are trying to get the "inside scoop" on selling these markets. Those answers are for members.
When the time is right we at WPT will become very aggressive on the short side to sell these markets, most likely when almost no one thinks this market can reverse and push lower, just the complete opposite as the lows near 1260SPX when the bears were calling for 3rd wave Armageddon wave counts and figures of 1000SPX.
I regularly see traders now accepting that we are likely going higher towards 1400SPX, it only took 80 points ;-) so now traders are eager to become bulls again, yet most times traders tend to buy into a move after 90% of the move is near over, and I don't think this time will be any different, it's always the same, most are bearish at the lows, and bullish at the highs.
So I suspect seeing new yearly highs will have most traders and the public at large calling for far higher. Maybe just the wrong time to be getting long, but we will deal with whatever comes along, until prices negate my bullish ideas, then those ideas are still on the table.
As you can see it hit a perfect 61.8% retracement, if Leonardo were alive today, I am sure he would be proud of the markets.
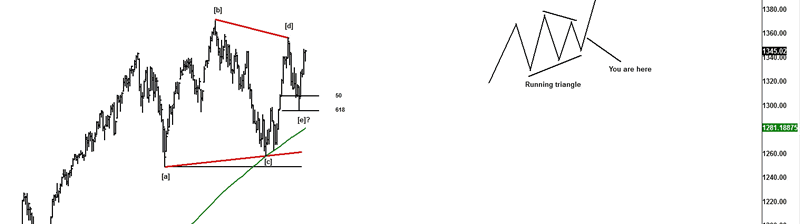
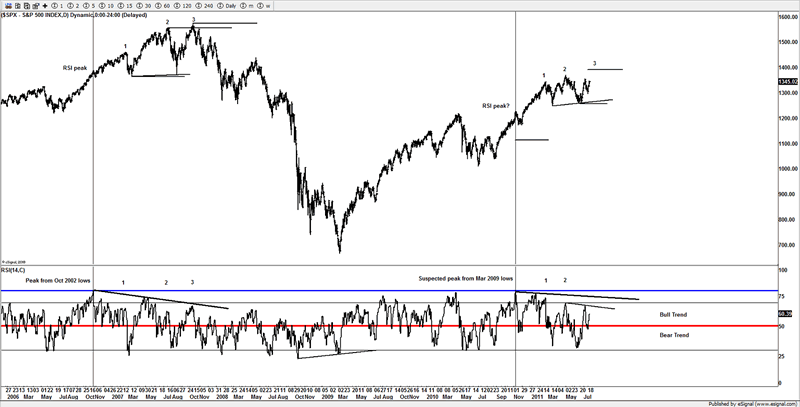
I showed this chart in last week's article, and starting to look really good, and whilst no one can be ever sure on an outcome, seeing that new high would further convince me that we were likely in a topping phase if we again, to put in the correct number of gyrations to confirm a completed pattern, and with a lower peak in the RSI, long term it looks like the previous analogue I mentioned last week.
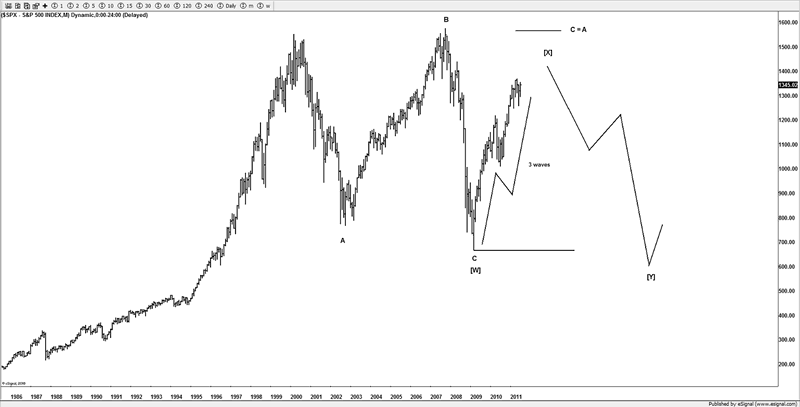
Whilst I have not been seduced with the Armageddon call to DOW 1000, I do have a potential wave idea on a yearly scale that could most defiantly see a test of the March 2009 lows again.
The RSI 50 mark was tested early last week, but once again the market has trapped the bears, and as long as price is above the 50 mark, the trend is still bullish.
The chart above is one of the reasons I actually am not calling for some super bullish wave count to 2000SPX etc, as the chart suggests atm, that we appear to be following the same sort of analogue, and in my view price action simply don't support a 3rd wave to the upside, so I guess I am going it alone against both the perma bears and perma bulls.
Seeing that new yearly high, would at least complete a pattern on an idea I have been following for a few months now and seeing a completed ABC count from the March 2009 lows, and thus could also be ending an alt idea to the super bearish wave counts the bears offer, whilst we could see a test of the March 2009 lows again, it's not likely to see extreme prices such as those being suggested by the Armageddon wave counts.
Still as I have mentioned before, these wave counts are generally not something I focus too much on, because as we have seen, it can take years before you can be wrong. We at WPT tend to stick to short term price charts on 15 and 60 min charts, that's where the real action is, I will leave the macro picture wave counts to the newsletters, as they don't really play a part in my game plan. But I thought I would whet the appetite of any bear still clinging on to seeing far lower.
As long as we remain on the correct side of the trend, that's really all I am interested in, the rest in general is for the magazines you sit and read whilst on the toilet.
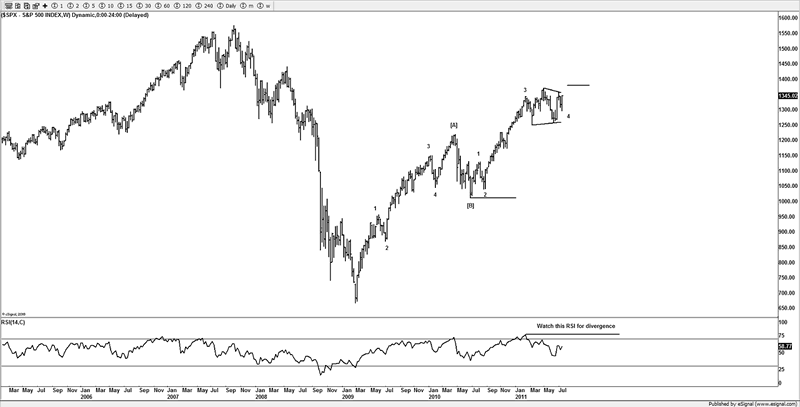
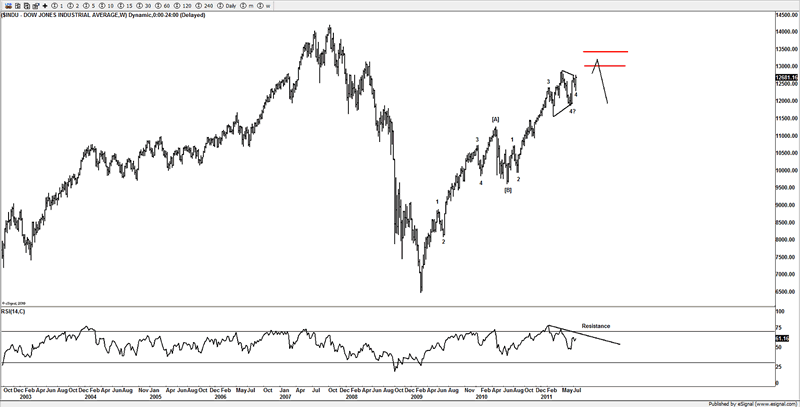
DOW
Using the same idea, it appears so far to be a 3 wave advance from the March lows 2009, the most important piece of information is what the RSI is doing, as if we were to see an explosive move to the upside, I would expect the RSI to confirm such a move by breaking the trend line which is resistance.
Whilst there is a target band higher, it can only be fined tuned as price structure dictates, and that comes from the 15 and 60min charts, which is what we specialize in.
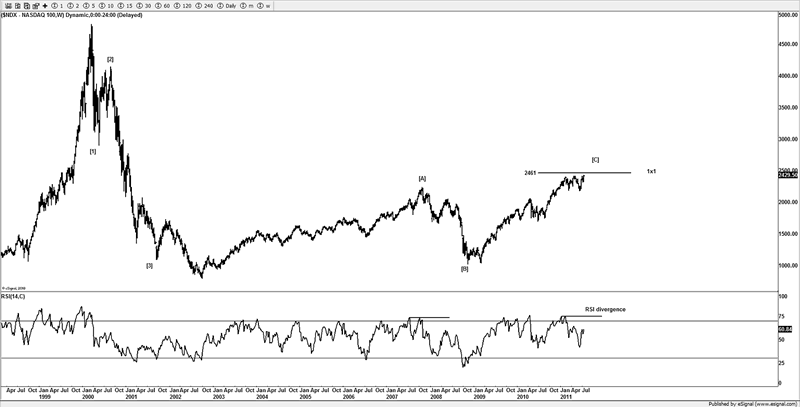
NDX
Looking at a longer term view, here is one idea of a ABC advance and the 1x1 target where C would equal A, and is looking very near to being completed, again we would need to see new yearly highs on the other markets in sync, to lift the NDX to hit its measured move target, so something to watch over the coming weeks, if the SPX and DOW lift high to their respective targets.
Looking at the RSI this sure looks like it's on its last legs and agrees with the chart I posted above regarding the previous analogue with 3 peaks.
If this was the start of some super bull market I would be expecting the RSI to confirm the idea.
EUR/USD
One market that appears to be generating interest is the EUR/USD pair, with the crisis potentially escalating in Europe; I think traders are puzzled to why the EUR/USD is moving higher.
Maybe it's simply that traders just want to buy the EUR against the US$? Have traders ever thought it could be that simple?
This is simply one of the reasons I let price do the talking, as I am simply not interested in what comes out of the mouths of politicians or governments, as that just causes confusion, traders dictate where price goes, and that comes from buying and selling.
Buying and selling leaves a path, and we can use that path the market markets to help predict a potential path.
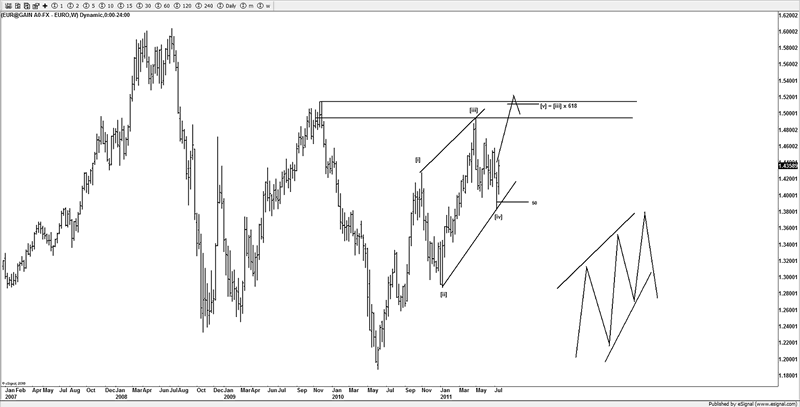
With the damage done to the US$ ala DX, the ending diagonal (ED) has now come to the forefront as our best working idea, the choppy range a week ago, never really gave much clarity, but the huge upside move in the EUR/USD pair this week, put this idea to the head of the class, and now has become the favorite idea and a 150-152 target is what we think is going to happen going forward.
Like all ideas, there is a cut of point where the idea gets negated, but having aggressively pushed through 142 and the 143-14320, we tend to favor the upside and seeing the 150-152 target band, that would also suggest seeing equities push higher as well thus seeing new lows on the DX towards 72, until this pair negates this ED idea, it's our main wave count going forward, and if we did see the 150-152 target, we feel it could offer one of the "trades of the year" , although we have had many trades of the year already ;-)
Come join us and take part in some of these huge moves in the FX markets, this is just a taster of some of the FX crosses we follow, we have so many FX crosses that we follow and setting up trade after trade, week after week, let alone what we follow in commodities and European and US stock markets.
Most traders should be aware that the US$ pushing lower is called "risk on" as the US$ pukes lower traders are buying assets, be it commodities, stocks, or higher yield currencies like the AUD$ etc
If you noticed the AUD/USD pair also moved in tandem with the large move in the EUR/USD and DX this week, thus confirming the moves in stocks and "risk" markets across the board.
SPX VS USD/CAD
USD/CAD as usual pukes lower when "risk" gets bought, as it's just one pair I like to use as a barometer to help predict where stocks are likely going, as seen in this chart, I have showed this before, but if you're not following the little edges the market is giving you, then you are making your job far harder than it need be, this is just one of many that I look at and base a theme on what is likely happening to markets going forward.
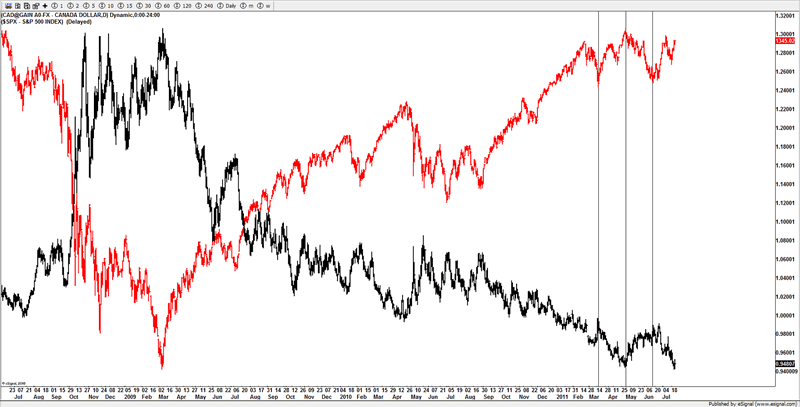
By monitoring and watching the AUD/USD and USD/CAD pairs, it has allowed us to stay on the right side of these moves you are witnessing, when pairs such as AUD/USD and USD/CAD are not confirming the bearish outlook on stocks, it simply seems ridiculous to even begin to think of crashes when other markets are not confirming the move.
I have a long term idea on both AUD/USD USD/CAD , that if correct, should setup further upside for stocks, as both those pairs are leading FX currencies that help confirm risk on/off etc.
Conclusion
Markets have did what I thought they would and nothing really to detract from my call of higher prices, although things can happen, and negate that idea, until such time that the market proves otherwise, then I suspect we are going to see new yearly highs and complete some long term ideas I have in some FX and equity markets both in the US and Europe.
I think we are now entering a time of increased volatility and the traders that get to grip with this sort of price action and stay on top of the moves are the ones that will come out with the substantial gains.
Stay tuned, I think we got a great opportunities coming.
Until next time.
Have a profitable week ahead.
Click here to become a member
You can also follow us on twitter
What do we offer?
Short and long term analysis on US and European markets, various major FX pairs, commodities from Gold and silver to markets like natural gas.
Daily analysis on where I think the market is going with key support and resistance areas, we move and adjust as the market adjusts.
A chat room where members can discuss ideas with me or other members.
Members get to know who is moving the markets in the S&P pits*
*I have permission to post comments from the audio I hear from the S&P pits.
If you looking for quality analysis from someone that actually looks at multiple charts and works hard at providing members information to stay on the right side of the trends and making $$$, why not give the site a trial.
If any of the readers want to see this article in a PDF format.
Please send an e-mail to Enquires@wavepatterntraders.com
Please put in the header PDF, or make it known that you want to be added to the mailing list for any future articles.
Or if you have any questions about becoming a member, please use the email address above.
If you like what you see, or want to see more of my work, then please sign up for the 4 week trial.
This article is just a small portion of the markets I follow.
I cover many markets, from FX to US equities, right the way through to commodities.
If I have the data I am more than willing to offer requests to members.
Currently new members can sign up for a 4 week free trial to test drive the site, and see if my work can help in your trading and if it meets your requirements.
If you don't like what you see, then drop me an email within the 1st 4 weeks from when you join, and ask for a no questions refund.
You simply have nothing to lose.
By Jason Soni AKA Nouf
© 2011 Copyright Jason Soni AKA Nouf - All Rights Reserved
Disclaimer: The above is a matter of opinion provided for general information purposes only and is not intended as investment advice. Information and analysis above are derived from sources and utilising methods believed to be reliable, but we cannot accept responsibility for any losses you may incur as a result of this analysis. Individuals should consult with their personal financial advisors.
© 2005-2022 http://www.MarketOracle.co.uk - The Market Oracle is a FREE Daily Financial Markets Analysis & Forecasting online publication.