Crude Oil Outlook Remains Strong, 2011 Halftime Report
Commodities / Crude Oil Jul 22, 2011 - 04:05 AM GMTBy: Frank_Holmes
 This year has been eventful for the oil patch. Natural disasters, revolutions, terrorist attacks and political maneuvering kept oil bouncing around $100 per barrel and 3.8 percent higher on the year at the end of June. Despite the volatility and large number of external forces affecting oil prices, the International Energy Agency (IEA) said in its most recent Oil Market Report that “the bull run evident since autumn 2010 therefore looks in large part to be justified by supply and demand fundamentals.”
Oil industry analyst PIRA estimates incremental demand will outpace supply by 1.1 million barrels per day on a year-over-year basis during the third quarter of 2011. The U.S. Energy Information Administration (EIA) says long-term supply/demand drivers indicate the market will remain tight for the foreseeable future as growing demand from emerging economies for liquid fuels and slowing non-OPEC supply growth “maintain upward pressure on oil prices.” The IEA forecasts oil prices to average $98 per barrel this year and $103 per barrel in 2012.
Oil Demand
The IEA forecasts the world will use 91 million barrels of oil per day in 2012, an increase of 1.5 million barrels per day. The IEA also revised its 2011 oil demand projections upward by 0.2 million barrels per day. Projecting outward to 2016, the IEA’s baseline scenario assumes a healthy 4.5 percent global GDP growth and an average oil price of $103 per barrel. With these assumptions, annual oil demand growth should average 1.2 millions barrels per day through 2016.
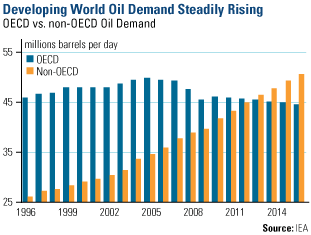
Emerging markets are almost entirely the source of this increased demand, with China accounting for 41 percent of demand growth over that time period, the IEA forecast says. The chart illustrates how developing (non-OECD) country oil demand has dramatically increased since the mid-1990s while developed world (OECD) demand has decreased. Through two financial bubbles and a global financial crisis, non-OECD demand has stair-stepped its way to nearly doubling in less than 20 years.

How is this possible? Many non-OECD markets have favorable demographics, rapidly urbanizing populations and industrializing economies that have returned many developing economies’ GDP growth rates to pre-crisis levels.
Rising incomes have also outpaced rising oil prices and sustained emerging market demand despite a general reduction in subsidies, the IEA says. Rising wealth has also established a new global middle class that the World Bank estimates will be more than 1 billion strong by 2030. In fact, the World Bank was cited in a National Geographic article earlier this year forecasting that for the first time ever, more people in the world will be classified as middle class than poor in 2022. Today, roughly 70 percent of the world’s population is classified as poor.
Major emerging market countries, such as China, India and Saudi Arabia, have reached the important GDP per capita range ($3,000-$20,000) where oil demand historically “takes-off.”
China carries the biggest stick among emerging markets when it comes to oil demand. Strict tightening measures from Beijing and rising inflation slowed the country’s oil demand growth to its lowest level since 2009 in June. However, China’s oil demand is still expected to grow 7 percent this year, which is inline with the country’s five-year average demand growth rate, according to Deutsche Bank. The summer months have historically been weak periods for oil demand in China but Deutsche Bank estimates growth rates will recover during the fourth quarter.
Chinese auto sales growth has slowed but still registered 10.9 percent year-over-year growth in June. In an interview with Maria Bartiromo for USA Today, Ford CEO Alan Mulally called China’s car market a “very exciting development.” The company is projecting China’s auto sales will reach 32 million by 2020—28 percent of the entire global market. Ford isn’t the only U.S. auto manufacturer tapping into China’s booming auto market; General Motors’ Buick brand is one of the most popular in the country. According to the Brookings Institute, General Motors sold 10 cars in the U.S. for every one car sold in China in 2004. Today, that figure is nearly 1-to-1.
In the developed world, the outlook for oil demand is less bullish. OPEC says the “austerity measures, combined with high levels of both debt and unemployment, are likely to dent the fragile recovery in major OECD countries.”
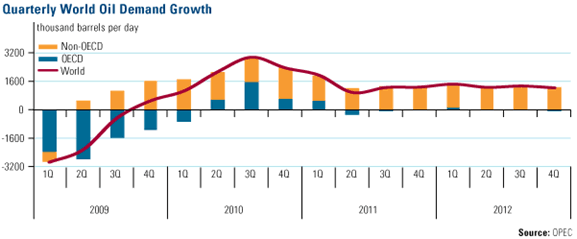
While demand growth in OECD countries is underwhelming, consumption rates have recovered from recession lows at a much faster rate than many expected. You can see that OECD demand contributed heavily to the recovery in global oil demand from early 2009 to late 2010. In fact, the developed world contributes little to global oil demand growth but still consumes more than half of the world’s total demand.

Despite China’s rise, OPEC says the fate of the U.S. economy is the most influencing factor for oil over the next 12 months. Oil demand in the U.S. was revised upward in May and the U.S. economy is forecasted to see 2.5 percent GDP growth in 2011.
PIRA says the U.S. economy is signaling strength in the second half of the year. It cites business capital expenditures as improving, which generally leads to employment gains and increased household consumption. It also expects a 20 percent hike in auto manufacturing output from the second quarter and an increase in consumer spending.
A big determinant of U.S. demand and consumer spending is gasoline prices, which the EIA forecasts to average $3.56 a gallon in 2011—up from $2.78 in 2010. U.S. consumers have already shown to be sensitive to higher prices with total motor gasoline consumption down more than 2 percent on a year-over-year basis during the second quarter. While OPEC expects U.S. gasoline consumption to return to normal rates, OPEC calls it oil’s “wild card” for 2012. Gasoline consumption could be negatively impacted by economic turbulence, such as a dip in employment.
Oil Supply
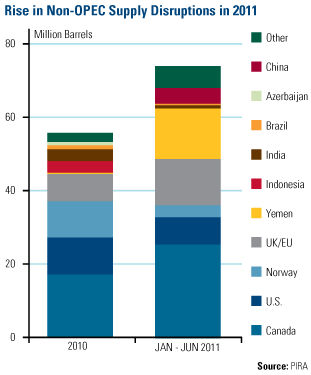
Oil production was rocked by several unexpected outages during the first half of 2011. The revolution in Libya, political divisions in Iraq, terrorist pipeline attacks in Nigeria, accelerating drug violence in Mexico and instability in Yemen have all negatively impacted oil production. PIRA puts the total loss of non-OPEC production at 74 million barrels. This is more than the entire amount of production losses in 2010.

Supply in the second half could also be affected by various factors such as hurricanes, maintenance issues and decline rates. The EIA is projecting non-OPEC crude production to increase by 540,000 barrels per day in 2011 and 740,000 barrels per day in 2012.
The IEA sees global production increasing by a little more than 1 million barrels per day annually until 2016. This is a result of increased capital expenditure, which has positively impacted existing assets and accelerated new projects, the IEA says. High oil prices are generating new supply, but non-OPEC growth is coming from higher cost areas, such as tar sands. Countries such as Colombia, China, Canada and the U.S. are expected to see the biggest gains.
OPEC production is expected to decline by roughly 300,000 barrels a day in 2011 and the EIA projects OPEC spare capacity to fall by 12.5 percent this year from 2010 and then another 11 percent in 2012.
It’s A Different Kind of Bull Market
If you’ve been around a while like me, you can remember the oil shocks of the 1970s. Oil prices skyrocketed and Americans waited in mile-long lines just to fill up their cars with gas. Today’s prices might conjure up some of those memories but we’re living in a different kind of bull market today. BCA Research says there are a few key reasons today’s bull market for oil is much different than the embargo-driven bull run from 1973-1980.
- Non-OPEC supply jumped from 27 to 41 million barrels per day in response to the embargo. Today, non-OPEC countries don’t have the ability to ramp up production like that. Even if they did, BCA says it wouldn’t be enough to keep pace with rising demand from developing countries.
- OECD countries drove global oil consumption in the 1980s, accounting for 70 percent of total demand. Today, that figure has dropped to 50 percent as the demand growth has shifted to emerging markets. Developing countries are less susceptible to higher prices because of subsidies, making similar demand destruction unlikely, BCA says.
- Global spare capacity has vanished so much that almost any oil-producing country, not just top producers such as Saudi Arabia and Russia, can cause a price spike by withholding access to its resources, BCA says.
Today’s oil market is much different than what we experienced back in the 1970s. Back then, countries such as China, India and Russia had no global footprint; they were isolationists. Russia was tucked away behind the Iron Curtain. Today these countries are building their economies and squeezing the existing supply of the world’s resources, including oil.
These factors indicate that growth in global oil demand will likely outpace increases in production capacity and create a “tighter market” than what the IEA expected back in 2010. As the IEA sums it up, “[the] market will ultimately adjust to higher prices, albeit supply and demand remain unresponsive in the short term. Indeed, oil’s price inelasticity underpins the recent extended upward price shift in the face of resilient non-OECD demand growth and perennial supply-side risks.”
None of U.S. Global Investors Funds held any of the securities mentioned in this article as of 6/30/2011.
Tune in to “Frank Talk” on Tuesday and Wednesday for second half 2011 previews of oil and copper.
U.S Global’s global market insights are now available “on the go” with mobile applications for the iPhone, Blackberry and iPad. Download the free apps today and access a whole new world of investing with the swipe of your finger. Download the apps.
By Frank Holmes
CEO and Chief Investment Officer
U.S. Global Investors
U.S. Global Investors, Inc. is an investment management firm specializing in gold, natural resources, emerging markets and global infrastructure opportunities around the world. The company, headquartered in San Antonio, Texas, manages 13 no-load mutual funds in the U.S. Global Investors fund family, as well as funds for international clients.
All opinions expressed and data provided are subject to change without notice. Some of these opinions may not be appropriate to every investor.
Standard deviation is a measure of the dispersion of a set of data from its mean. The more spread apart the data, the higher the deviation. Standard deviation is also known as historical volatility. All opinions expressed and data provided are subject to change without notice. Some of these opinions may not be appropriate to every investor. The S&P 500 Stock Index is a widely recognized capitalization-weighted index of 500 common stock prices in U.S. companies. The NYSE Arca Gold BUGS (Basket of Unhedged Gold Stocks) Index (HUI) is a modified equal dollar weighted index of companies involved in gold mining. The HUI Index was designed to provide significant exposure to near term movements in gold prices by including companies that do not hedge their gold production beyond 1.5 years. The MSCI Emerging Markets Index is a free float-adjusted market capitalization index that is designed to measure equity market performance in the global emerging markets. The U.S. Trade Weighted Dollar Index provides a general indication of the international value of the U.S. dollar.
Frank Holmes Archive |
© 2005-2022 http://www.MarketOracle.co.uk - The Market Oracle is a FREE Daily Financial Markets Analysis & Forecasting online publication.


