


U.S. Economy Inflation R.I.P. Deflation
Economics / Inflation Jul 17, 2011 - 06:30 AM GMTBy: EconMatters

 Despite a big 4.4% drop off from energy prices in June following a 1.0% fall in May, the latest BLS data showed that the Consumer Price Index (CPI) for June was still up 3.6% year-over-year.
The core CPI (less food and energy), an inflation gauge watched closely by the Federal Reserve, also increased 1.6% year-over-year, and has been steadily rising and most of the increase has come within the past six months. (See Charts Below)
What's more telling is that the CPI numbers would have been a lot more intense without the 4.4% drop in energy. Notably also, the core CPI is closing in on Fed's long-run overall core inflation target of 1.7% to 2%. Beneath the main number, the CPI for food was up 3.7%, and the index for food at home has jumped 4.7% over the last 12 months, with all the major groups increasing 3.2% or more, while the energy index spiked 20.1%.
Inflationary pressure is also building up in Producer Price Index (PPI). Compared to a year earlier, producer prices were up 7.0% while the core rose 2.4%, the largest increase since July 2009 (See Chart Below). This is after taking into account that gasoline prices slumped 4.7%, while residential electric power costs declined a record 2%.
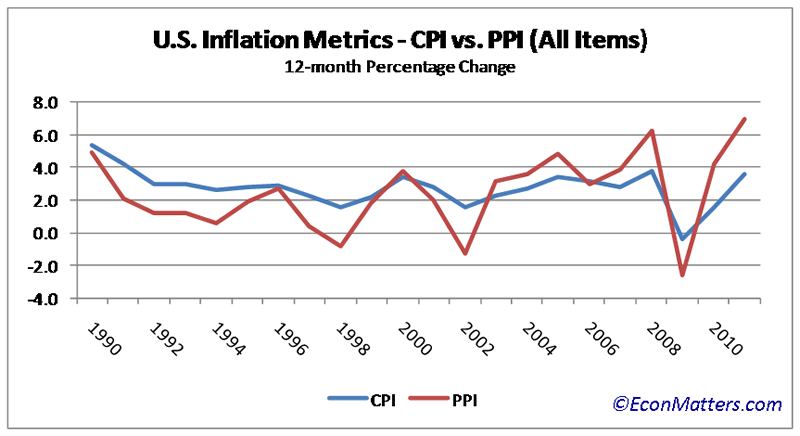
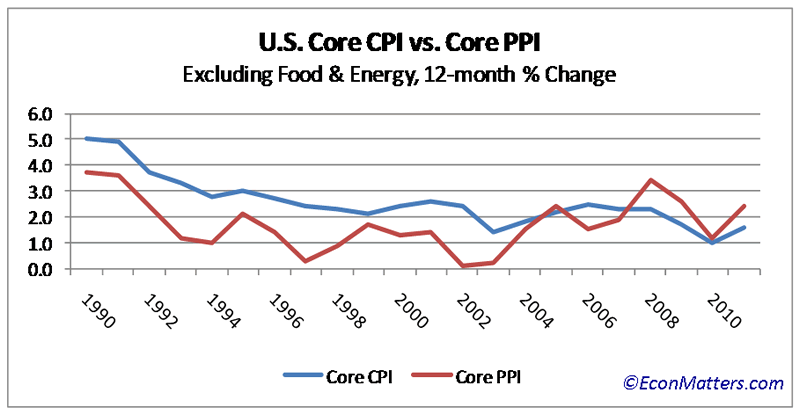
There is typically a time lag before the cost increases could work through the supply chain from producers to consumers, depending on the type of goods. By looking at the two charts comparing CPI and PPI on all items and core (excluding the more volatile food and energy), one thing worth noting is that in the past twenty years, based a 12-month percentage change, CPI (all items, as well as core) historically had outpaced PPI until around 2003-2005 time frame.
However, since 2008, the more definitive trend has been that producer prices running much higher than consumer prices, yet we haven't really seen a corresponding CPI jump yet in the past two years. In fact, the subdued consumer inflation prompted a wide-spread deflation scare even among the Federal Reserve members and was cited as one of the supporting factors for QE2.
But theoretically, the two indexes should connect where rising prices at the producer level will eventually be passed through to consumers or producers’ profits would suffer with rising input costs.
In an interview with The Atlantic, Barry Bosworth at Brookings Institution noted CPI and PPI baskets have different weights on different items in the index. Services have a heavier weight in CPI than in PPI, thus price changes in goods affect PPI more. So the recent commodity price spikes going into goods have caused PPI to rise a lot more than CPI.
Furthermore, Bosworth pointed out that CPI also tracks housing, which is still stuck in the deep down cycle, whereas PPI does not track housing. This difference deflates CPI compared to PPI.
Ultimately, this means consumers are experiencing the prices on day-to-day consumer staple goods at much higher escalation than the CPI implies, and that producers eventually must either increase their prices to account for the rising input costs or tighten their belts to weather the low profitability. (Based on a recent mall expedition, the latter seems to be the case, at least for the clothing retail sector.)
Some, including the Fed, argue that since materials now account for a much smaller portion of the goods producing cost structure than in the past, as a result, the input cost inflation at the producers is unlikely to show up at the consumer level.
In other words, the Fed is counting on the stagnant wage, contained by the current high unemployment rate, to offset the rampant material price inflation partly fueled by QE2.
The services part of the overall cost structure will ultimately need to rise up to meet (at least reasonably) the actual rate of inflation, and the cost of living, or there will be a whole new set of social and economic troubles worse than the current 9.2% unemployment would entail.
Commodities have been on a tear ever since Bernanke’s Jackson Hole speech building up inflation expectation before the actual QE2 program even started. We caught a glimpse of the redux on Wed. July 13 when the Fed Chairman stunned the world in his testimony to the U.S. Congress that the central bank is ready for the next round of stimulus if the economy continues to weaken.
Crude oil shot up about $1.50 a barrel immediately after Bernanke’s QE3 talk which just goes to show the connection between inflation expectation and Fed’s quantitative easing. That might be one of the reasons for Bernanke’s follow-up qualifying statement that there’s no immediate plan for a third round of quantitative easing.
In the next year or two, it looks like there could be two scenarios emerging:
A new global crisis, for example, the U.S. fails to raise the debt ceiling, a wider-than-expected euro debt contagion, or a collapse of the euro.
Economic recovery really takes hold in the coming quarters with good jobs and GDP numbers.
For now the odds seem better for the first scenario. Nevertheless, either way, inflation and inflation expectation would only be shooting north. And this latest set of BLS inflation numbers seems to indicate the actual catch-up and pass-through of higher input costs from the producer to the consumer side is already taking shape.
Fed Chairman Bernanke told Congress that central bank officials anticipate that the recent rise in inflation appears likely to be transitory, where in fact the only 'transitory' effects are the QE3 euphoria and the once prevalent "deflation alarm".
Fed’s QE2 brought excessive liquidity on Wall Street that should have gone to the Main Street, which not only has weakened the dollar, dimished consumers' purchasing power, but also has artificially inflated asset prices. The damage to the economy far outweights the benefit of propping up the stock market, that not even a Strategic Petroleum Reserve sale by the IEA could mitigate the inflationary effect of QE2.
The recent economic, employment indicators and consumer sentiment basically have given QE2 an 'F' on the report card. So learning form the past two rounds of QE, unless Brent crude oil comes down to the high $70's to low $80’s a barrel range, and a more effective implementation and distribution system where the money would go to stimulate the real economy, QE3 should never even have been brought up in any kind of monetary policy discussion.
Of course, I'm speaking on the basis of financial common sense and logic, which may or may not be the course the Fed and Washington would take.
Further Reading - Why The Fed Must End Quantitative Easing
Disclosure - No Positions
By EconMatters
The theory of quantum mechanics and Einstein’s theory of relativity (E=mc2) have taught us that matter (yin) and energy (yang) are inter-related and interdependent. This interconnectness of all things is the essense of the concept “yin-yang”, and Einstein’s fundamental equation: matter equals energy. The same theories may be applied to equities and commodity markets.
All things within the markets and macro-economy undergo constant change and transformation, and everything is interconnected. That’s why here at Economic Forecasts & Opinions, we focus on identifying the fundamental theories of cause and effect in the markets to help you achieve a great continuum of portfolio yin-yang equilibrium.
That's why, with a team of analysts, we at EconMatters focus on identifying the fundamental theories of cause and effect in the financial markets that matters to your portfolio.
© 2011 Copyright EconMatters - All Rights Reserved Disclaimer: The above is a matter of opinion provided for general information purposes only and is not intended as investment advice. Information and analysis above are derived from sources and utilising methods believed to be reliable, but we cannot accept responsibility for any losses you may incur as a result of this analysis. Individuals should consult with their personal financial advisors.
© 2005-2022 http://www.MarketOracle.co.uk - The Market Oracle is a FREE Daily Financial Markets Analysis & Forecasting online publication.