


When To Buy A Stock That’s Been Correcting
InvestorEducation / Learning to Invest Jul 15, 2011 - 01:18 AM GMTBy: David_Grandey

At some point, a stock that’s been on a big run, will turn tail and go into a correction. Such behavior is normal, it allows investors to take profits and buy again or add to their current position at lower prices.
But often the initial selling can be intense and scary, making it difficult to navigate the ideal time to buy the stock as no one likes catching a falling knife. For those who understand chart pattern recognition, the ideal time to buy eventually becomes clear. SLV below offers a good example:
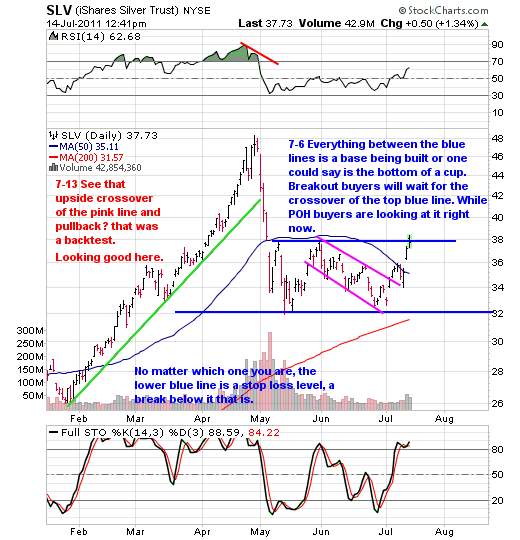
It only took 5 days for SLV to lose its luster and go from $48 to $34. But it eventually stabilized and established support as shown by the bottom blue line. After trading in a range for a bit, it eventually formed a bullish pullback off highs channel (pink lines) that coincided with a double bottom.
It was at that point that we featured SLV to our paying subscribers.
So when is the best time to buy the stock? Well you have two ideal buy points.
1. A break above the top of the pink line — those that did are currently enjoying a gain of close to 12% in just a few days!
2. The upper blue line represents the top of “the bottom of the cup”. Today’s break above it is what we call the “Right Side Of The Cup Crossover”. As long as it remains above the upper blue line, odds favor SLV continuing to build the right side of what looks like a cup-shaped consolidation pattern.
Buying at either of these two points sure beats waiting for SLV to retest its old highs in the $48 range
By David Grandey
www.allabouttrends.net
To learn more, sign up for our free newsletter and receive our free report -- "How To Outperform 90% Of Wall Street With Just $500 A Week."
David Grandey is the founder of All About Trends, an email newsletter service revealing stocks in ideal set-ups offering potential significant short-term gains. A successful canslim-based stock market investor for the past 10 years, he has worked for Meriwest Credit Union Silicon Valley Bank, helping to establish brand awareness and credibility through feature editorial coverage in leading national and local news media.
© 2011 Copyright David Grandey- All Rights Reserved
Disclaimer: The above is a matter of opinion provided for general information purposes only and is not intended as investment advice. Information and analysis above are derived from sources and utilising methods believed to be reliable, but we cannot accept responsibility for any losses you may incur as a result of this analysis. Individuals should consult with their personal financial advisors.
© 2005-2022 http://www.MarketOracle.co.uk - The Market Oracle is a FREE Daily Financial Markets Analysis & Forecasting online publication.