Most Popular
1. Banking Crisis is Stocks Bull Market Buying Opportunity - Nadeem_Walayat
2.The Crypto Signal for the Precious Metals Market - P_Radomski_CFA
3. One Possible Outcome to a New World Order - Raymond_Matison
4.Nvidia Blow Off Top - Flying High like the Phoenix too Close to the Sun - Nadeem_Walayat
5. Apple AAPL Stock Trend and Earnings Analysis - Nadeem_Walayat
6.AI, Stocks, and Gold Stocks – Connected After All - P_Radomski_CFA
7.Stock Market CHEAT SHEET - - Nadeem_Walayat
8.US Debt Ceiling Crisis Smoke and Mirrors Circus - Nadeem_Walayat
9.Silver Price May Explode - Avi_Gilburt
10.More US Banks Could Collapse -- A Lot More- EWI
Last 7 days
Stock Market Volatility (VIX) - 25th Mar 24
Stock Market Investor Sentiment - 25th Mar 24
The Federal Reserve Didn't Do Anything But It Had Plenty to Say - 25th Mar 24
Stock Market Breadth - 24th Mar 24
Stock Market Margin Debt Indicator - 24th Mar 24
It’s Easy to Scream Stocks Bubble! - 24th Mar 24
Stocks: What to Make of All This Insider Selling- 24th Mar 24
Money Supply Continues To Fall, Economy Worsens – Investors Don’t Care - 24th Mar 24
Get an Edge in the Crypto Market with Order Flow - 24th Mar 24
US Presidential Election Cycle and Recessions - 18th Mar 24
US Recession Already Happened in 2022! - 18th Mar 24
AI can now remember everything you say - 18th Mar 24
Bitcoin Crypto Mania 2024 - MicroStrategy MSTR Blow off Top! - 14th Mar 24
Bitcoin Gravy Train Trend Forecast 2024 - 11th Mar 24
Gold and the Long-Term Inflation Cycle - 11th Mar 24
Fed’s Next Intertest Rate Move might not align with popular consensus - 11th Mar 24
Two Reasons The Fed Manipulates Interest Rates - 11th Mar 24
US Dollar Trend 2024 - 9th Mar 2024
The Bond Trade and Interest Rates - 9th Mar 2024
Investors Don’t Believe the Gold Rally, Still Prefer General Stocks - 9th Mar 2024
Paper Gold Vs. Real Gold: It's Important to Know the Difference - 9th Mar 2024
Stocks: What This "Record Extreme" Indicator May Be Signaling - 9th Mar 2024
My 3 Favorite Trade Setups - Elliott Wave Course - 9th Mar 2024
Bitcoin Crypto Bubble Mania! - 4th Mar 2024
US Interest Rates - When WIll the Fed Pivot - 1st Mar 2024
S&P Stock Market Real Earnings Yield - 29th Feb 2024
US Unemployment is a Fake Statistic - 29th Feb 2024
U.S. financial market’s “Weimar phase” impact to your fiat and digital assets - 29th Feb 2024
What a Breakdown in Silver Mining Stocks! What an Opportunity! - 29th Feb 2024
Why AI will Soon become SA - Synthetic Intelligence - The Machine Learning Megatrend - 29th Feb 2024
Keep Calm and Carry on Buying Quantum AI Tech Stocks - 19th Feb 24

Market Oracle FREE Newsletter

How to Protect your Wealth by Investing in AI Tech Stocks

Stock Market Inflection Point

Stock-Markets / Stock Markets 2011 Jul 14, 2011 - 01:41 PM GMT

By: Tony_Caldaro

Stock-Markets

For those new to the blog we would like to restate something we did during the last bull market. The SPX/NDX can offer confusing patterns. Their futures contracts are heavily traded which causes volatility. In fact, occassionally a wave does not appear where it should, or a wave occurs that shouldn’t. How do we know? The DOW.


The DOW is, and has been, the key index for the US stock market. Yes, it has become more of an international index, but as the world’s largest consumer/innovator so has the US. For the past six years or so the SPX/DOW have remained in sync, wave for wave. So this fact is easy to forget. My point is this: When analyzing the US market the DOW should be reviewed first. Let’s look at the last nine years, starting in Oct 2002.

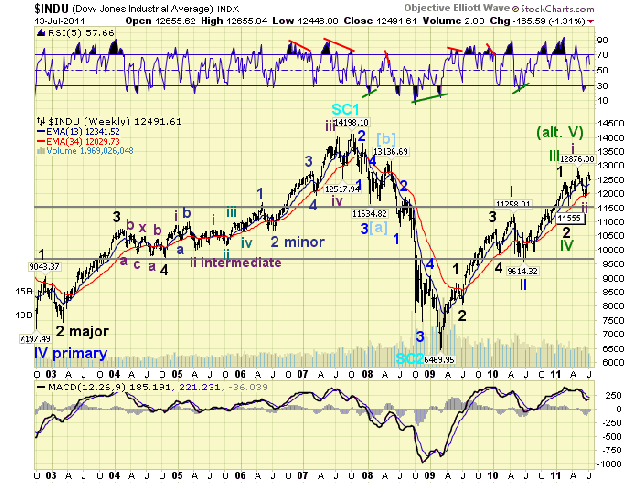
From Oct02 to early ’05 the DOW rallied in what could have been counted as five waves. The market was even threatening to break down as the weekly MACD hit neutral. After a small correction the DOW rallied to a new high around Mar05 and then broke to a lower low. Notice the MACD again went to neutral threatening to fall into bear market territory. The key level to watch was what we had marked as Major wave 4, around 9,700. The market had to make a decision: bull or bear, an inflection point. It chose bull.

Flash ahead to today. From Mar09 to present we can again count a potential five waves up in the DOW: Apr10, Jly10, Feb11, Mar11 and Apr11. After a minor correction we are now uptrending again. Notice where the MACD is this time. No threat of a breakdown.
If we count five waves up, the recent correction and current uptrend would be part of the next bear market. If we use the count posted, we’re looking for a significant uptrend to clear the bull market highs and allow enough room for a correction without an overlap. Notice the big difference in price between the Mar11 low and the Jun11 low. This can not be counted as a flat. These are separate waves. Also, it would be quite unusual to count it as a part of a triangle since the rally above Major 1 was quite high. This leaves us with two counts. The original one posted and the alternate count.

Should the DOW break down below the Mar11 low (11,555) the alternate count comes into play. Until then the market suggests it’s going higher.

CHARTS: http://stockcharts.com/...

http://caldaroew.spaces.live.com

After about 40 years of investing in the markets one learns that the markets are constantly changing, not only in price, but in what drives the markets. In the 1960s, the Nifty Fifty were the leaders of the stock market. In the 1970s, stock selection using Technical Analysis was important, as the market stayed with a trading range for the entire decade. In the 1980s, the market finally broke out of it doldrums, as the DOW broke through 1100 in 1982, and launched the greatest bull market on record. 

Sharing is an important aspect of a life. Over 100 people have joined our group, from all walks of life, covering twenty three countries across the globe. It's been the most fun I have ever had in the market. Sharing uncommon knowledge, with investors. In hope of aiding them in finding their financial independence.

Copyright © 2011 Tony Caldaro - All Rights Reserved Disclaimer: The above is a matter of opinion provided for general information purposes only and is not intended as investment advice. Information and analysis above are derived from sources and utilising methods believed to be reliable, but we cannot accept responsibility for any losses you may incur as a result of this analysis. Individuals should consult with their personal financial advisors.


© 2005-2022 http://www.MarketOracle.co.uk - The Market Oracle is a FREE Daily Financial Markets Analysis & Forecasting online publication.


Comments

David J. Harris
14 Jul 11, 22:47
Stock Market Inflection Point - Response

Tony,

I follow your articles closely and thank you for your published analysis, which has helped me in my understanding of wave analysis.

There appears to be a resistance level for the DOW at about 12,570 which has been tested several times over the past few days. If the market breaks this resistance level then it will indeed go higher, however, if not we will see a down trend. The models that I have in place are showing the market now in a short-term down trend into July and August and perhaps September. A Head and Shoulder pattern seems to be forming, and we are now coming of the right-hand side shoulder in a down trend.

I am anticipating a low that is in the range of 10,800 to 11,600 on the DOW, and therefore a low that will break through the 2011 March low. This would be the bottom of Wave 4 that has been forming since late April (and part of a 5 wave move that has been running up since the March low in 2009).

I am anticipating that this new low in the summer (and all the fear that goes with it) will be all that Ben Bernanke needs to get support for QE3 which will be required to push the DOW up to the range 14,000 to 14,700 in Q4 of 2012 just before the next presidential election. Bernanke has already stated (most recently this week) that he will add further stimulus if needed, and my estimate is that QE3 will begin Q4 2011 or Q1 2012, and run up to November 2012. A stimulus program that will last about 9 to 12 months.

The DOW is following a similar kind of pattern to the mid 1970's. Nevertheless, this does not bode well for the period 2013 to 2016. Whoever is president during this 4 year period to 2016 is going to have a heck of a job on their hands once the DOW starts to drop after the new high has been made. If Obama gets in for a second term then this will be a bonus since he will be more likely to make really hard decisions that are more characteristic of a second term, than a new incoming president, and it is going to be hard decisions that are needed.

Cheers,

David J. Harris


Post Comment

Only logged in users are allowed to post comments. Register/ Log in