


How the Stock Market Market Prices In Recession
Stock-Markets / Stock Markets 2011 Jul 14, 2011 - 05:02 AM GMTBy: Tony_Pallotta

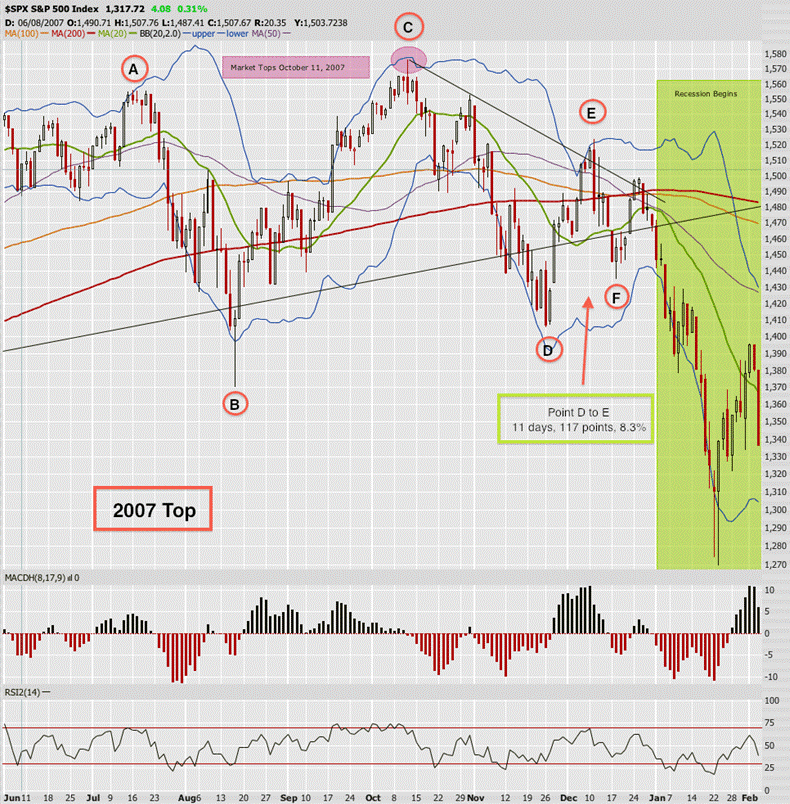
 Recently I compared the 2007 equity topping pattern to that of the current market. The premise being today as in 2007 the US economy is quite possibly entering economic recession. Long gone are the days of equity markets being forward looking as proven in 2007 when they peaked just two months before contraction began. A similar pattern is also playing out in the 10 year treasury.
I suspect a topping market is more a function of psychology and less technicals or macro data. The money making bull is slowly dying while the bears are eager for their turn to shine. The result of this clash of views and buying power is dictated more by emotional, whipsawing action where convictions in one's position and volatile price action make coexistence difficult if not impossible.
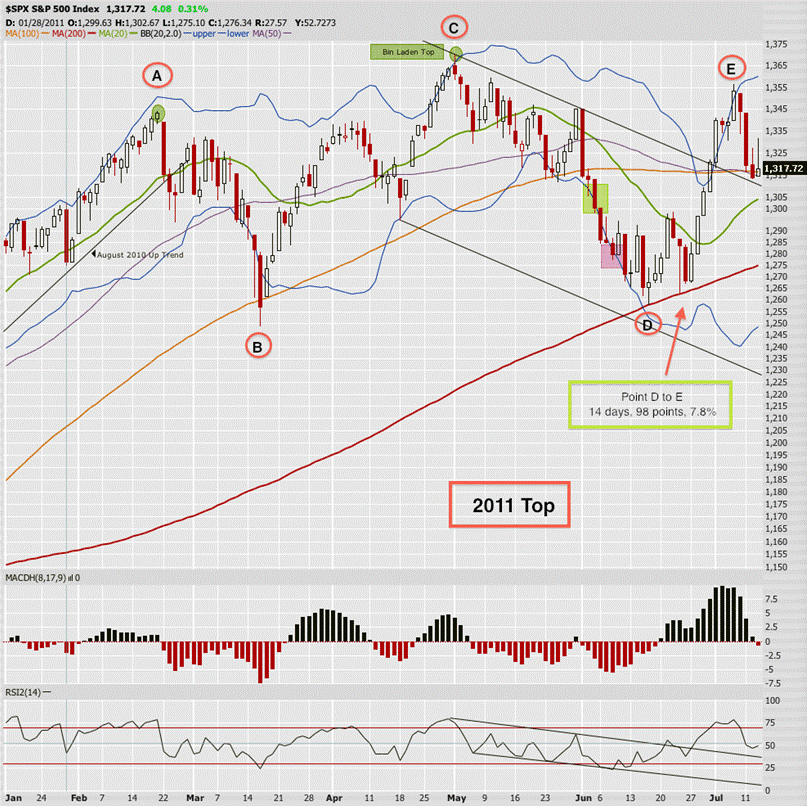
In the original post the question was "are we forming Point E." Well it appears Point E has in fact been formed and the pattern continues to play out almost text book. Some will argue in 2007 we were trading below the 200MA for example but I reiterate topping patterns may be more psychological and less technical in nature.
In comparing the two patterns what's most interesting is that "last dash for yield" from Point D to E.
In 2007 the SPX traded 117 points or 8.3% higher in 11 days while breaking the downtrend.
In 2011 the SPX traded 98 points or 7.8% higher in 14 days while breaking the downtrend.
The last piece of the puzzle would be Point F (an appropriate label) where markets attempt once last rally while the macro data finally confirms what many had feared, that this soft patch is anything but "transitory."
"Successful trading is always an emotional battle for the speculator, not an intelligent battle." ~ Jesse Livermore
By Tony Pallotta
Bio: A Boston native, I now live in Denver, Colorado with my wife and two little girls. I trade for a living and primarily focus on options. I love selling theta and vega and taking the other side of a trade. I have a solid technical analysis background but much prefer the macro trade. Being able to combine both skills and an understanding of my "emotional capital" has helped me in my career.
© 2011 Copyright Tony Pallotta - Disclaimer: The above is a matter of opinion provided for general information purposes only and is not intended as investment advice. Information and analysis above are derived from sources and utilising methods believed to be reliable, but we cannot accept responsibility for any losses you may incur as a result of this analysis. Individuals should consult with their personal financial advisors.
© 2005-2022 http://www.MarketOracle.co.uk - The Market Oracle is a FREE Daily Financial Markets Analysis & Forecasting online publication.