


Stock Market Panic Levels, the VIX, and the NYSE New Lows...
Stock-Markets / Volatility Jul 14, 2011 - 02:01 AM GMTBy: Marty_Chenard

 Many regard the VIX as a measurement of fear and panic levels in the market. But, how do you really know what the fear level is?
One way is to keep an eye on the NYSE (New York Stock Exchange) New Lows for the day. As fear levels rise, the daily number of New Lows should also be rising ... if they aren't, then you have to question how much fear is really in the market.
One thing is true ... the greater the acceleration of fear levels, the greater the daily level of New Lows.
Why is that?
It is because, if fear levels continue to accelerate, then at some point investors will feel enough pain to begin panicking. When panic selling starts to set in, stocks move lower and lower, eventually reaching a point where the next person holding the stock becomes an emotional basket case ... panics, and sells his stock. Since the stock is dropping, more than likely he will have to sell at a lower price in order to get out of the stock.
Thus, a cycle of panic grows until it is overdone and the pendulum then swings back the other way.
*** So, the VIX closed higher yesterday, indicating increased fear levels. But, has panic set in yet?
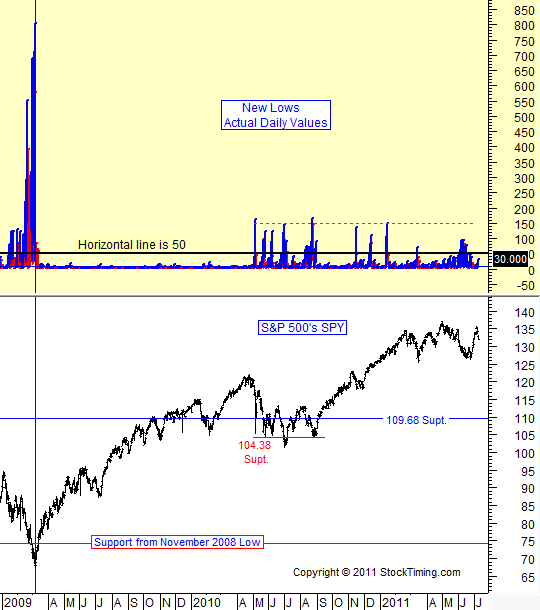
For the answer, let's take a look at yesterday's chart of New Lows on the NYSE. As you can see (below), the level of New Lows came in at 30 yesterday.
How should you interpret that?
Here are rules to consider:
- If the New Lows are below 28, that is still bullish.
- If the New Lows rise above 28, that is starting to show "concern about the market".
- If the New Lows move above 50 per day, then panic levels are starting to be seen.
- If the New Lows move higher than 100, especially above 150, then panic levels are becoming a serious issue for the market.
When using the New Lows, do integrate what is happening with them along with what is happening to the action on the VIX at the same time. (For our daily subscriber analyses, we use a total of 9 different market conditions to arrive at the answer on a daily basis.) FYI ... be sure to also see Monday's update about: "Is this a Dangerous Technical Formation?"
By Marty Chenard
http://www.stocktiming.com/
Please Note: We do not issue Buy or Sell timing recommendations on these Free daily update pages . I hope you understand, that in fairness, our Buy/Sell recommendations and advanced market Models are only available to our paid subscribers on a password required basis. Membership information
Marty Chenard is the Author and Teacher of two Seminar Courses on "Advanced Technical Analysis Investing", Mr. Chenard has been investing for over 30 years. In 2001 when the NASDAQ dropped 24.5%, his personal investment performance for the year was a gain of 57.428%. He is an Advanced Stock Market Technical Analyst that has developed his own proprietary analytical tools. As a result, he was out of the market two weeks before the 1987 Crash in the most recent Bear Market he faxed his Members in March 2000 telling them all to SELL. He is an advanced technical analyst and not an investment advisor, nor a securities broker.
Marty Chenard Archive |
© 2005-2022 http://www.MarketOracle.co.uk - The Market Oracle is a FREE Daily Financial Markets Analysis & Forecasting online publication.