


Learn How to Trade the Gold GDX Fibonacci Butterfly Options Spread
InvestorEducation / Options & Warrants Jul 13, 2011 - 12:48 AM GMTBy: J_W_Jones

 One of the many useful characteristics of options is that the astute trader can design strategies to capture profit from predicted price action forecasts from a wide variety of technical indicators. I think it is helpful to have knowledge of several approaches to technical analysis in order to recognize patterns that other traders may not see.
Today I would like to introduce the topic of a technical pattern that is not commonly discussed and demonstrate its ability to give a high probability trade in a liquid underlying, the Market Vectors Gold Miners ETF, symbol $GDX.
The basis of the trade I would like to discuss is that of a Fibonacci butterfly, in this case, a bearish Fibonacci butterfly. This pattern is derived from price relationships and the proclivity of these relationships to form predictable zones of price resistance and reversals.
The subject of the Fibonacci sequence, its origin, and potential applications is well beyond the scope of this posting. Suffice it to say that the numerical relationships found within the Fibonacci series have wide distributions across a host of natural relationships. For those interested in learning more about these relationships and their derivations, any internet search engine will point to a huge trove of supplementary information.
The Fibonacci butterfly was best described initially by legendary trader Larry Pesavento. It represents one of two well defined Fibonacci reversal patterns that include both the Gartley and the butterfly. For those traders just beginning to wrap their heads around option terminology, I should point out that this butterfly is completely unrelated to the family of butterflies an option trader may elect to use as a trade structure choice. Don’t let your butterflies get confused!
These are reversal patterns and identify high probability areas of change in price direction. The pattern is stereotypical and consists of: an impulsive initial move in price, either up or down, often including gap movement (the X:A thrust) ; retracement of that initial move (A:B counterthrust) to the 0.618 to around the 0.786 Fibonacci level; retracement of that retracement (the B:C secondary thrust); and the final retracement (the C:D counterthrust) which results in completion of the pattern.
The final C:D leg for a butterfly pattern completes when price reaches the zone between 1.272 and 1.618 Fibonacci extension of the initial price movement. Once this final C:D leg has completed within this defined Fibonacci zone, the predicted price movement is in the direction of the initial X:A movement.
It is important to await confirmatory triggers prior to initiating trades from these patterns because these patterns may fail and failed patterns very often lead to explosive moves in the direction of the failure.
Now, if your head has not yet exploded, and you are still reading, it is much easier to understand with a picture.
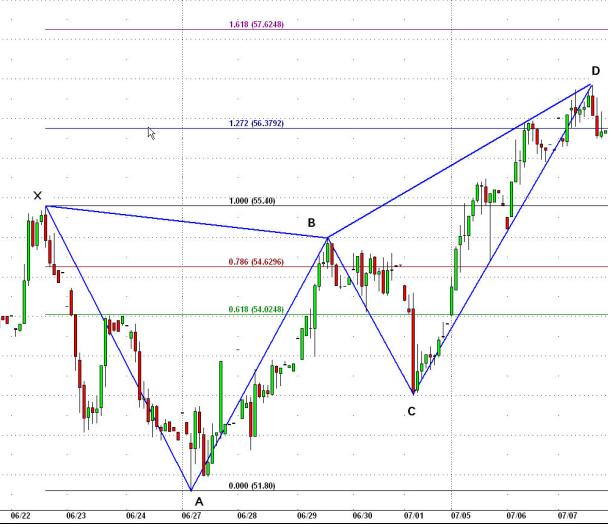
The horizontal lines with numbers represent the various Fibonacci retracement levels that are important. For this pattern, focus on the B point a bit above the 0.786 retracement of the initial thrust, and the D point of pattern completion between the 1.272 and 1.618 levels. These Fibonacci tools are present in all modern charting packages and make calculation of critical levels instantaneous.
Triggers usually are taken from the next lower time frame. In this case, dropping from the illustrated 60 minute time frame in which the pattern completed, a bearish engulfing candlestick completed on the next 30 minute candle. The bearish trade was triggered.
The next decision was the option structure that would be most efficient to capture the expected move. A major factor to consider in this decision was that the July options cycle was only 9 days from expiration. The worst performing trade was to buy out-of-the-money puts because of the rapid time decay the position would suffer.
I also considered a put butterfly structure, but knew that adverse price action this close to expiration could be difficult to withstand. Remember that butterflies react strongly to price change close to expiration because gamma becomes quite large. Another structure I considered was that of a calendar trade, selling the weekly option and buying the monthly.
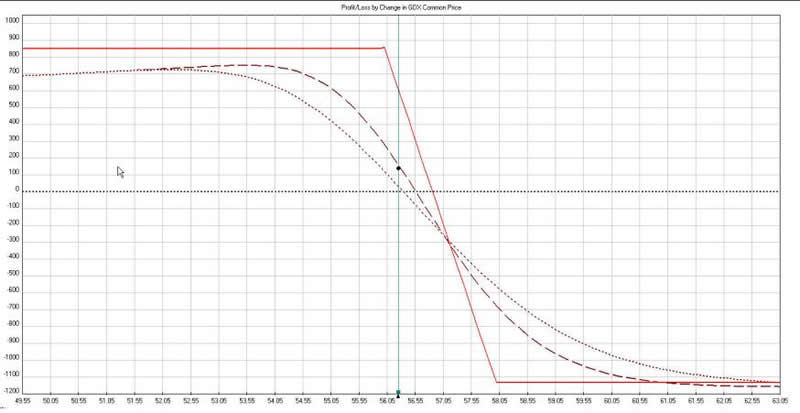
In the end, I decided to use the structure of a put vertical illustrated below. In this case I used a conservative structure, buying an in-the-money put, the 58 strike, and selling an at-the-money 56 strike. The chart below illustrates the profit and loss of a spread constructed in a 10x10 (10 Long July GDX 58 Puts / 10 Short July GDX 56 Puts) setup.
The trade did not last long; I closed it approximately 24 hours later on stronger than expected price action and failure to get rapid follow through on the completed bearish butterfly pattern. The result of the trade was a return of 16.5% on invested capital.
Recognition of patterns not routinely followed by the investing herds can often lead to solid risk / reward trades. Using options in a knowledgeable fashion to structure these trades can further increase your probability of success.
If you would like to be informed several times per week on SP 500, Volatility Index, Gold, and Silver intermediate direction and options trade alerts… take a look at http://www.optionstradingsignals.com/specials/index.php today for a 24 hour 66% off coupon, and/or sign up for our occasional free updates.
J.W. Jones is an independent options trader using multiple forms of analysis to guide his option trading strategies. Jones has an extensive background in portfolio analysis and analytics as well as risk analysis. J.W. strives to reach traders that are missing opportunities trading options and commits to writing content which is not only educational, but entertaining as well. Regular readers will develop the knowledge and skills to trade options competently over time. Jones focuses on writing spreads in situations where risk is clearly defined and high potential returns can be realized.
This article is intended solely for information purposes. The opinions are those of the author only. Please conduct further research and consult your financial advisor before making any investment/trading decision. No responsibility can be accepted for losses that may result as a consequence of trading on the basis of this analysis.
© 2005-2022 http://www.MarketOracle.co.uk - The Market Oracle is a FREE Daily Financial Markets Analysis & Forecasting online publication.