Gold and Silver Summer Trend Update
Commodities / Gold and Silver 2011 Jul 12, 2011 - 02:19 AM GMTBy: Peter_Degraaf
 Historically the precious metals prices drift lower during the summer months, with a bottom in July, although sometimes not until August. At this time of year demand from India is less because the festivals are over and demand from jewelers is low because of summer holidays. Investment demand is also down because buyers are expecting a correction.
This historical precedence (low summer prices), has been nourished by a number of analysts. (Any connection between the names used in this essay and living persons is purely coincidental). ‘Low-price Larry’ has predicted a collapse in the gold price since early this year. ‘Oriental Steve’ predicted on May 7th that gold and silver would drop to their 200 day moving averages by July 7th. In 2009, ‘craptal Dave’ predicted that silver would drop sharply. (The price rose instead). He called for a major long term top at the end of his 64 month cycle to occur in February of 2011. Gold refused to comply and has risen 10% since then. Last we heard of ‘craptal Dave’ he shorted gold at the end of June at $1515, hoping for a drop to $1462. It has been rumored that he considers his craptal system to be more effective than fundamentals.
We can only guess at why some analysts keep calling for major corrections and predicting ‘long-term tops’. Could it be that they get so wrapped up in technical analysis that they neglect to study the fundamentals? Applying technical analysis without considering the fundamentals is like driving your car while looking in the rear view mirror.
The fundamentals for gold and silver have never been as bullish as they are today. Money printing around the world is happening so rapidly there is some concern that we may run out of trees. Meanwhile Chinese and Indian investors are trading their Yuan and Rupee’s for something with more lasting value, gold and silver. Greeks and Italians are worried about the banking system and buying gold coins. Mints around the world are setting production records to fill orders from retail customers. Despite a record high gold price, new supply from mines is declining, due to the fact that the ‘easy to find gold’ has already been found. Comparing the current gold bull market to the 1970’s bull market we find that there are currently 2.4 billion people in the world who were not alive in 1980. That is an increase of 53%! A large percentage of this huge increase has occurred in china and India. By coincidence the people in those two countries love to own gold. Investment demand is increasing worldwide as more and more people begin to understand the steady decline in the value of their currency. It is a historical fact that once a country goes down the path of currency inflation, (instead of taxation in order to pay its debt), in every instance that currency eventually became worthless and had to be replaced. This has happened in at least 40 countries (including the USA), in the past.
Governments have two ways of robbing the people of the fruits of their labor: taxes and the systematic destruction of the purchasing power of their currency.
This next chart shows us that the trend of bond holders selling bonds to buy gold is again picking up momentum.
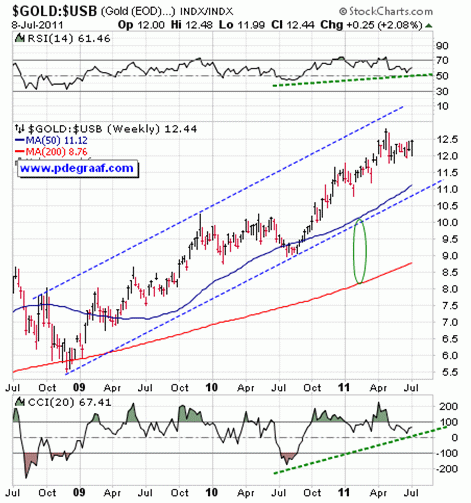
This chart features the index that compares gold to bonds. The blue channel is rising by 25% per year. As long as price remains in this channel those who own gold will earn 25% more than those who hold 30 year bonds. The supporting indicators are positive (green lines), with room to rise. The 50 week moving average is in positive alignment to the 200 week moving average (green oval), and both are rising. All of this makes for a bullish trend.
In 1953, during the last audit of the U.S. gold reserves, the gold was referred to as ‘Gold Bullion Reserves’. Then in 2001 the description was changed to: ‘Custodial Gold Bullion.’ Six months later the description changed to: ‘Deep Storage Gold’. Could this mean that the above ground gold is gone and replaced by gold that is yet to be mined?
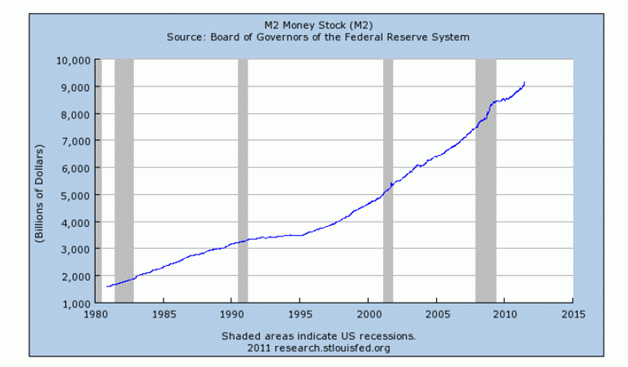
This chart courtesy Federal Reserve Bank of St. Louis tracks the M2 money supply. The latest reading was reported on Friday and shows quite a jump – from 9068 billion dollars on June 20th to 9144 billion on June 27th. This is an increase of 76 billion dollars in just one week. Could this be the result of a “new QE program?”
Monetary inflation is like toothpaste. Once out of the tube, it cannot be put back in. It would require withdrawing money form the economy which would cause serious social unrest.
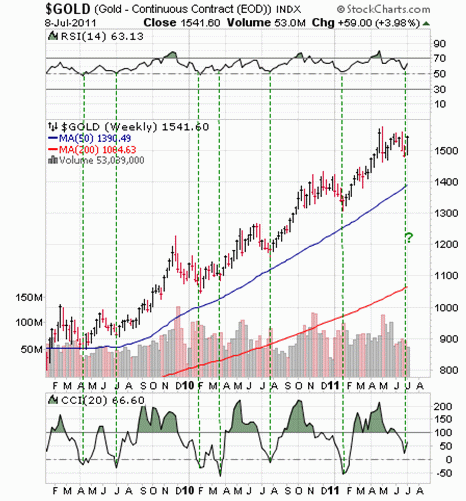
Featured is the weekly gold chart. Whenever the RSI rises from ‘50’ and the CCI for ‘0’ you can usually count on a multi-week rally. According to the International Strategy and Investment Group (ISI), gold makes up 0.07% of total global assets. In 2001 it was 0.3% (the all-time low). In 1980 while gold peaked, the ratio rose to 3%. In 1968 during a gold bull market it rose to 4.8%. For the current 0.07% to double, would require 10 years of gold production.
“When plunder becomes a way of life for a group of men in a society, over the course of time they create for themselves a legal system that authorizes it and a moral code that glorifies it." Frederic Bastiat (from his booklet: “The Law”)
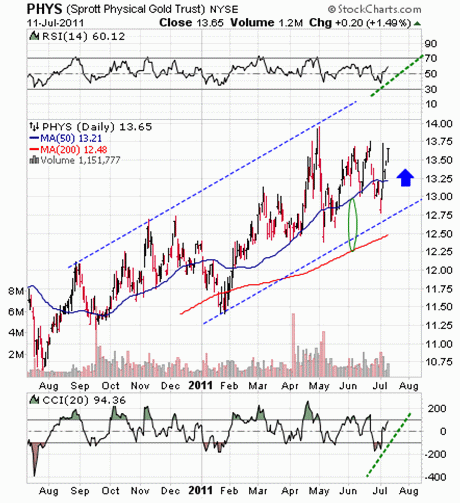
Featured is the daily bar chart for PHYS the Sprott gold trust. Price is preparing to scale new heights. The supporting indicators are positive with room to rise and the moving averages are positive and rising. Any dips to or below the 50 day moving average are likely to turned out as opportunities to buy.
In 1929 Homestake Mining, a gold producer, traded at 4.19. By 1935 the share price rose to 495.00.
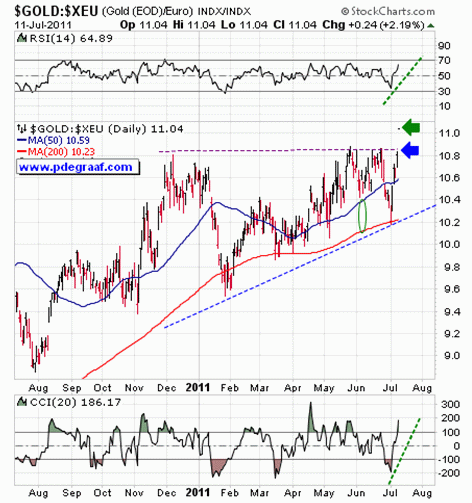
Featured is the gold price in Euros. We alerted our subscribers last week that a breakout at the blue arrow would be very bullish, with a target at 12.3 Euros. Price has now produced a breakout, and closed at 11.04. It is quite likely that the gap produced on Monday will be filled, but as soon as price confirms the breakout by closing above the green arrow, the rally to 12.3 will be underway.
“There is no subtler, no surer means of overturning the existing basis of society, than to debauch the currency. The process engages all the hidden forces of economic law on the side of destruction, and does it in a manner which not one man in a million is able to diagnose.” …..John. M. Keynes.
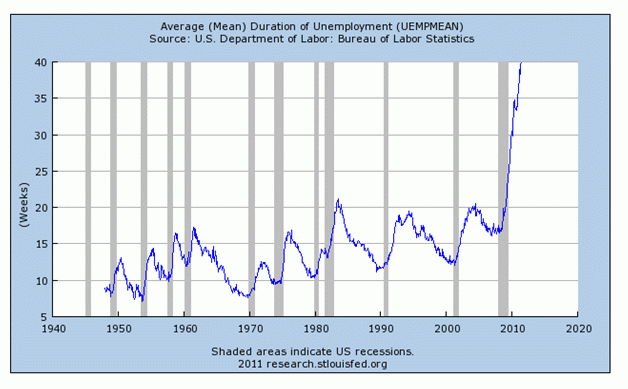
This chart courtesy Federal Reserve Bank of St. Louis shows the duration of US unemployed workers which continues to lengthen. As tragic as this is for those who are unemployed, there is no mistaking that this trend is bullish for gold and silver, as it persuades politicians and the Federal Reserve to run the printing presses, to pay for unemployment benefits and food stamps and welfare payments.
“The same central banks that sold gold at bargain prices, will at some point try to replace their gold reserves. They will use the printing press to accomplish this goal.” ….. Ferdinand Lipps. (Veteran Swiss banker).
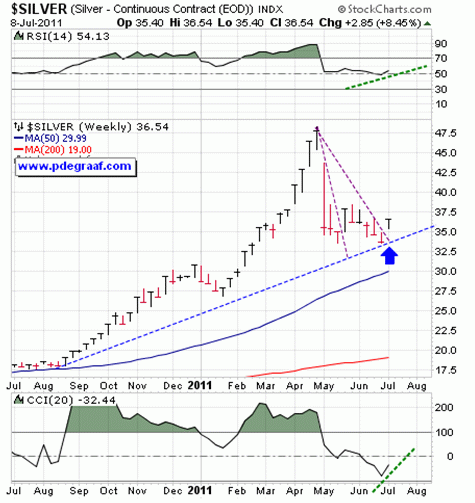
Featured is the weekly silver chart. Price has just broken out from beneath resistance and the supporting indicators (SIs) are turning positive. The RSI looks very similar to the August 2010 chart pattern. Silver back then rose for several months.
According to the Silver Institute, Industrial demand for silver is expected to rise to 666 million ounces by 2015. This is a 36% increase from 487 million ounces in 2010.
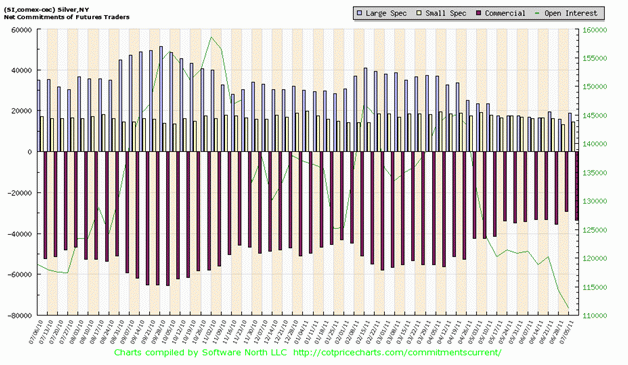
This chart courtesy Cotpricecharts.com shows the ‘net short’ position to be at 33 after reaching a long-time low of 29 last week. It shows reluctance on the part of commercial silver traders to add to their short positions. The last time we were at 33 was in July of 2008. Silver was trading at 13.87 back then and rose to 17.66 by October. The current ‘net short position’ in silver is too large to be bought back. It currently totals over 200 million ounces of silver. The bullion banks involved are trapped. All they can do is attack the silver price with ‘paper silver’ every now and then in an effort to shake some ‘weak hands’ out of the market. Until this short position is covered, the main trend in silver is up – up – up!
Summary: A good analyst would never tell his subscribers to short gold or silver during a bull market. For one thing it plays into the game plan of the central banks that have a vested interest in keeping prices down. Scaling sell orders into rallies, after scaling in buy orders during a pullback is the perfect way to play a bull market. Anything else borders on greed. Hedging a long position with a shorting ETF or with distant puts makes sense for experienced traders but going short in a bull market can be financial suicide for investors. My investment performance is posted at my website under ‘Stock Pick of the Week.’
Happy trading!
By Peter Degraaf
Peter Degraaf is an on-line stock trader with over 50 years of investing experience. He issues a weekend report on the markets for his many subscribers. For a sample issue send him an E-mail at itiswell@cogeco.net , or visit his website at www.pdegraaf.com where you will find many long-term charts, as well as an interesting collection of Worthwhile Quotes that make for fascinating reading.
© 2011 Copyright Peter Degraaf - All Rights Reserved
DISCLAIMER: Please do your own due diligence. I am NOT responsible for your trading decisions.
Peter Degraaf Archive |
© 2005-2022 http://www.MarketOracle.co.uk - The Market Oracle is a FREE Daily Financial Markets Analysis & Forecasting online publication.


