World's High Debt Default Risk Countries
Interest-Rates / Global Debt Crisis Jul 07, 2011 - 11:26 AM GMTBy: Jenson
 Top Risky countries in the world
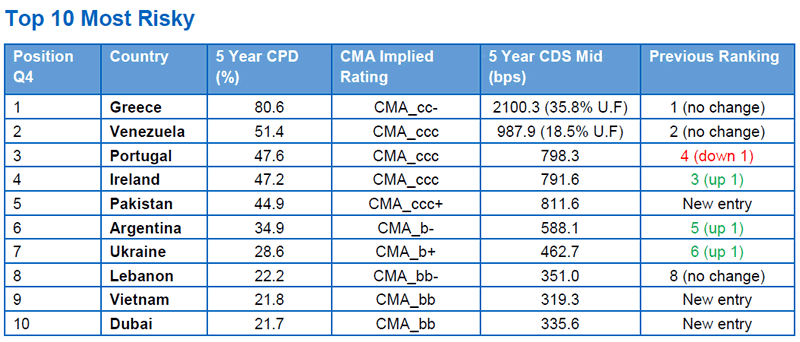
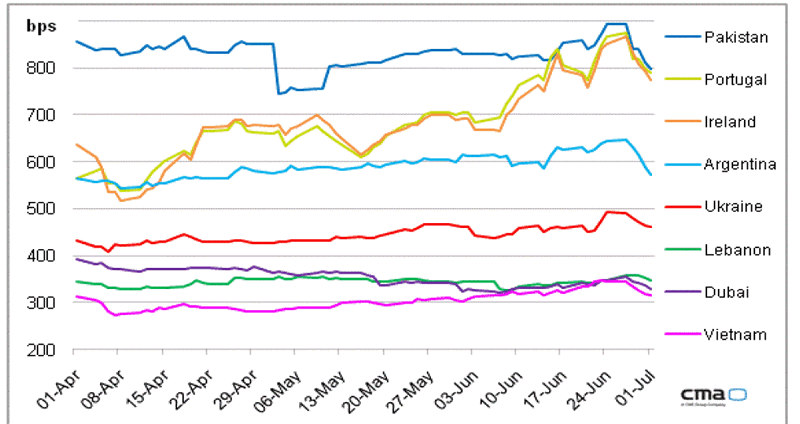
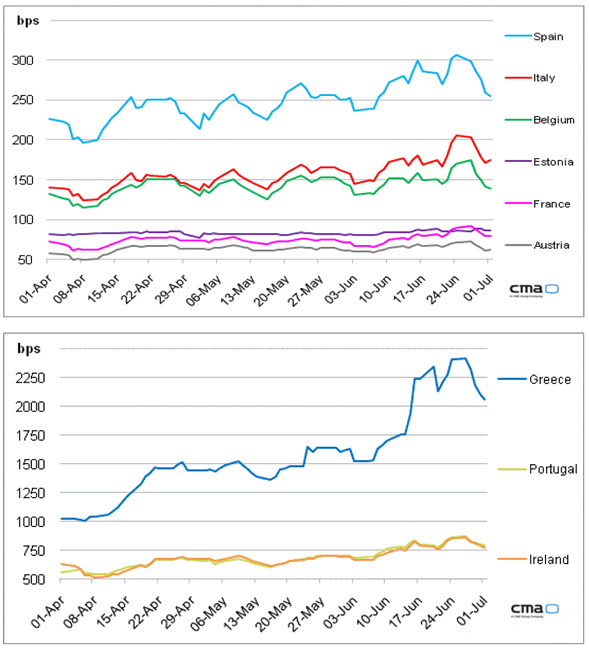
■ Greek spreads peaked on 27th June – one day before the austerity measures set by the EU and IMF were approved by the Greek parliament. Spreads rallied following the decisive vote, but remain high with five year probability of restructuring at 80% and the markets expecting it to take around two years for the austerity measures to drive down the cost of borrowing.
■ Pakistan enters the top 10, following a pick up in liquidity this quarter, but remains thin with bid/ask spreads around 100bp and quote volumes light.
■ Vietnam enters the top 10, following rallies in Iraq and Egypt which exit the top 10.
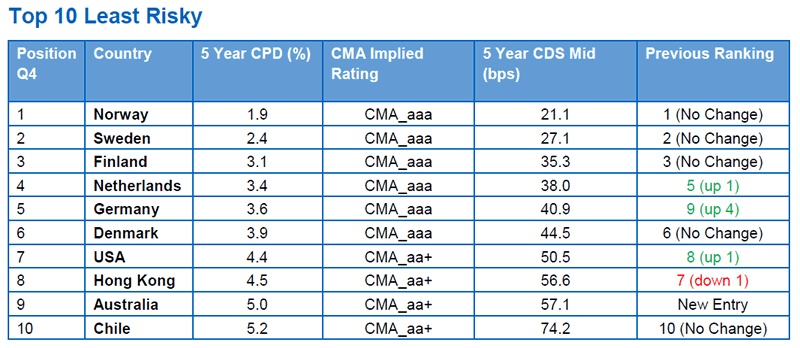
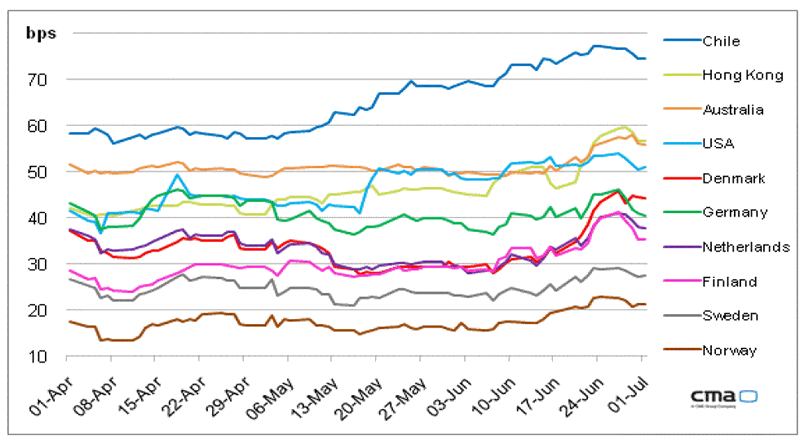
No change in the top three, with Finland widening 4bp over the quarter.
■ Germany moves up to 5th place, as the strong economy outweighs the EU’s woes over Greece, Portugal and Ireland.
■ Australia enters the top 10 as a lack of liquidity in Switzerland sees it dropped from the report.
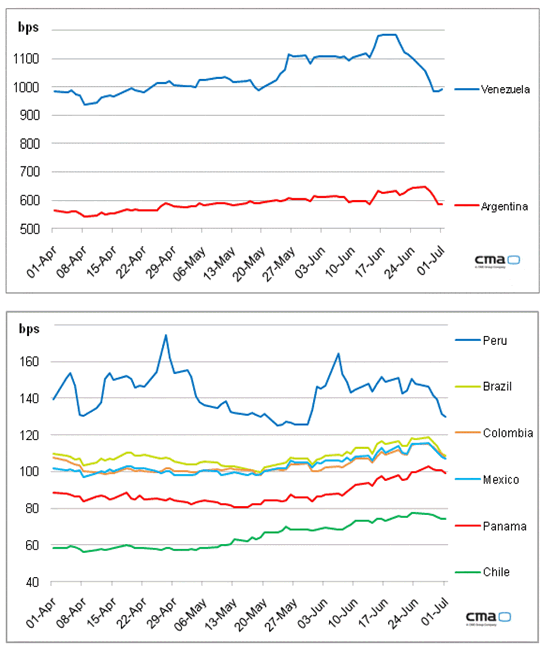
■ Spreads in Chile widen to 74bp this quarter, as the ‘premium’ for strong emerging market economies such
as Chile were perhaps a little over-stretched at the beginning of the quarter.
This quarter’s best performers were dominated by the Middle East, with Bahrain being the top performer.
■ Data for Costa Rica is derived using CMA’s sector model as liquidity is extremely thin.

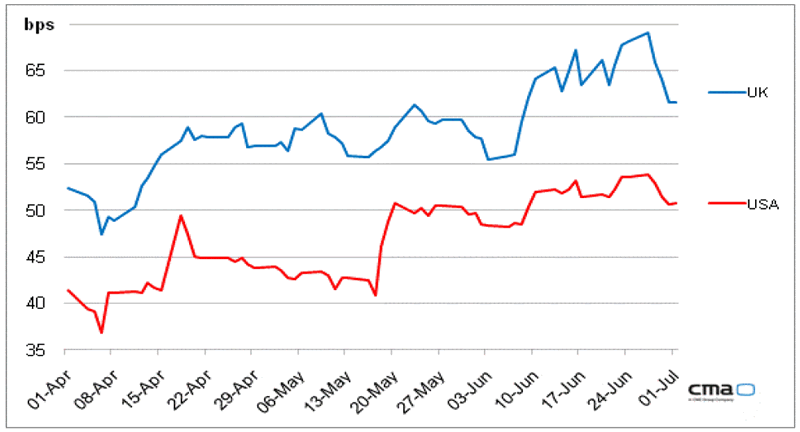
Regional Focus: USA and UK
■ The CDS curve for the United States flattened at the end of May, as concerns of a technical default from delays in the budget approval process saw increased demand from buyers of short-term protection. S&P
also put the world’s largest economy on negative watch. The CMA CDS implied rating dropped to CMA_aa+ from CMA_aaa this quarter.
■ Spreads for the UK widened gradually this quarter, following weak signals in the economy and also peaked
on the 27th June to 69bp but rallied sharply to 62bp, finishing the quarter 10bp wider.
Regional Focus: Western Europe
■ It was another busy period for EU administrators in Brussels as they try and work out an austerity and borrowing package which will avoid a restructuring of debt in Greece. They can take some comfort in the fact that spreads in countries which would have high implied CDS FX devaluation effects on the Euro (Italy, France, Austria) remained relatively stable.
■ The implied CDS devaluation effect for Greece is around 3% (Euro/US Dollar) devaluation. The Euro declined from 1.48 to 1.43 following the increased prospect of a default by Greece.
Regional Focus: Asia
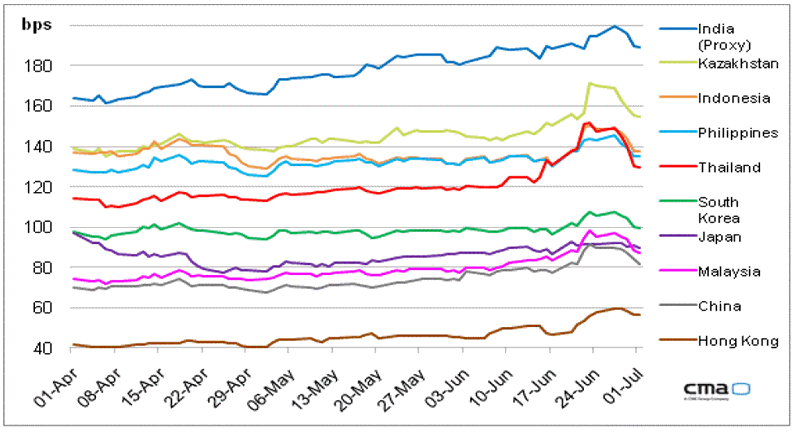
■ A relatively quiet period for the region. However all the curves peak at the end of June, indicating that the concerns in Europe could have a potential impact on export-driven Asian economies.
■ Vietnam remains the outlier in the group.
Regional Focus: Central & South America
■ Spreads in South America drifted wider from the middle of the quarter, indicating some profit-taking and perhaps concerns that the emerging market risk premium is too high.
■ One year protection in Brazil was 13bp lower than one year United States at the end of May.
■ Venezuela ended the quarter fairly flat, staying in the top 10 most risky table. (Recovery = 25%).
Source : http://gmbpost.com/investment-news/charts-of-country-wise-risk/
by Jenson
Bio: Worked with a hedge fund for 10 years as a Director and now work with the consulting firm "GMB post"
© 2011 Copyright Jenson - All Rights Reserved
Disclaimer: The above is a matter of opinion provided for general information purposes only and is not intended as investment advice. Information and analysis above are derived from sources and utilising methods believed to be reliable, but we cannot accept responsibility for any losses you may incur as a result of this analysis. Individuals should consult with their personal financial advisors.
© 2005-2022 http://www.MarketOracle.co.uk - The Market Oracle is a FREE Daily Financial Markets Analysis & Forecasting online publication.


