Gold Price Should Double
Commodities / Gold and Silver 2011 Jul 05, 2011 - 07:02 AM GMTBy: Tony_Caldaro
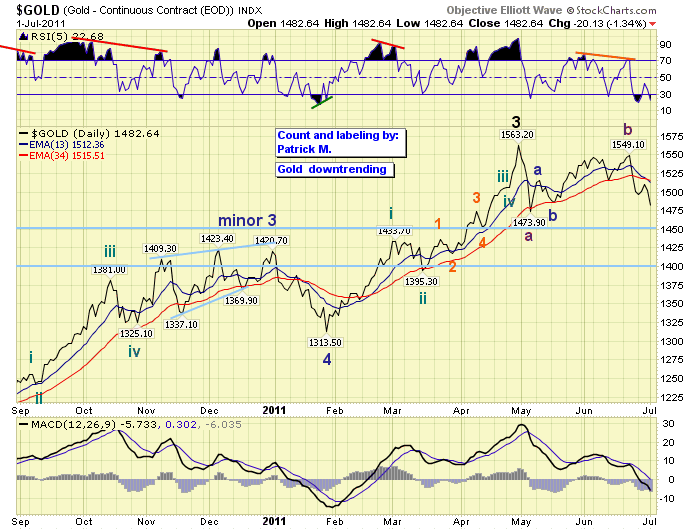
 While the potential for a continued extension of Major wave 3, of Primary V, did not pan out: http://caldaro.wordpress.com/.... The primary count, an Intermediate wave B rally, did. Gold is now in a downtrend and still correcting in Major wave 4, after completing a Major wave 3 high at $1563 in late April.
In our last lengthy report: http://caldaro.wordpress.com/..., we suggested a potential $1700+ high for Major wave 3, then a sharp decline. Apparently most of the action occurred in the Silver market as many hedge funds were long Silver/short Gold, or long Silver/short the miners. This would explain why Gold had a minor decline of about 6%, while Silver lost around 30%. An unwind of these types of positions would be to sell Silver and buy Gold. Nevertheless, this 10 year bull market continues with three more years to go.

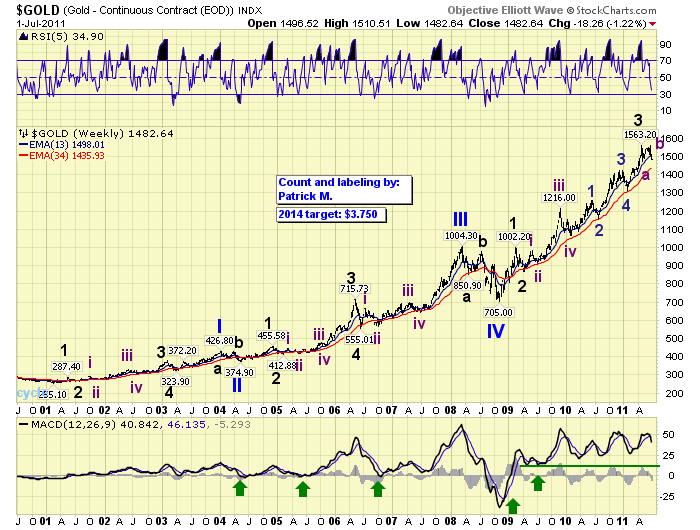
The weekly chart displays the entire bull market since 2001. Notice Gold has completed four Primary waves, as of 2008, and has been in Primary V ever since. Primary V, btw, is already longer than Primary waves I through III in price. Since fifth waves in commodity bull markets usually enter a blow off parabolic stage, we’re expecting Gold to be a lot higher before this bull market ends in 2014. Our target remains $3750.

After the current correction, Major wave 4, concludes this month in the expected support zone posted on the daily chart ($1400-$1450). We expect an even more extended Major wave 5. Major wave 3 had an extended Intermediate wave v and took two years to unfold. Major wave 5 may have extended Intermediate third and fifth waves and should take three years to unfold.
To determine some potential resistance zones for Major wave 5, which will complete Primary wave V and the bull market. We could use the fibonacci relationships of Primary waves I and III using the Primary wave IV $705 level as the reference low. At $1725 Primary V equals 1.618 Primary III. At $2350 Primary V equals 2.618 Primary III. Then at $3370 Primary V equals 4.234 Primary III. Next at $1915 Primary V equals 1.618 Primary waves I through III. At $2665 Primary V equals 2.618 Primary waves I through III. Then at $3875 Primary V equals 4.234 Primary waves I through III. Therefore the resistance levels are as follows: $1725, $1915, $2350, $2665, $3370 and $3875, should we get that high. When Major wave 4 concludes, and OEW confirms the next uptrend, we’ll be able to include Major waves 1 through 3 in our fibonacci analysis. That will be our next update.
CHARTS: http://stockcharts.com/...
http://caldaroew.spaces.live.com
After about 40 years of investing in the markets one learns that the markets are constantly changing, not only in price, but in what drives the markets. In the 1960s, the Nifty Fifty were the leaders of the stock market. In the 1970s, stock selection using Technical Analysis was important, as the market stayed with a trading range for the entire decade. In the 1980s, the market finally broke out of it doldrums, as the DOW broke through 1100 in 1982, and launched the greatest bull market on record.
Sharing is an important aspect of a life. Over 100 people have joined our group, from all walks of life, covering twenty three countries across the globe. It's been the most fun I have ever had in the market. Sharing uncommon knowledge, with investors. In hope of aiding them in finding their financial independence.
Copyright © 2011 Tony Caldaro - All Rights Reserved Disclaimer: The above is a matter of opinion provided for general information purposes only and is not intended as investment advice. Information and analysis above are derived from sources and utilising methods believed to be reliable, but we cannot accept responsibility for any losses you may incur as a result of this analysis. Individuals should consult with their personal financial advisors.
© 2005-2022 http://www.MarketOracle.co.uk - The Market Oracle is a FREE Daily Financial Markets Analysis & Forecasting online publication.


