


Stock Market Rally Overbought, Correction Likely
Stock-Markets / Stock Markets 2011 Jul 05, 2011 - 01:19 AM GMTBy: Andre_Gratian

 Very Long-term trend - The continuing strength in the indices is causing me to question whether we are in a secular bear market or two consecutive, cyclical bull/bear cycles. In any case, the very-long-term cycles are down and, if they make their lows when expected, there will be another steep and prolonged decline into 2014-16.
Long-term trend - In March 2009, the SPX began a move which evolved into a bull market. Cycles point to a continuation of this trend for several more months.
SPX: Intermediate trend - The SPX has probably completed its correction, but there may be some additional consolidation before it makes a new high.
Analysis of the short-term trend is done on a daily basis with the help of hourly charts. It is an important adjunct to the analysis of daily and weekly charts which discusses the course of longer market trends.
Market Overview
Last week, the stock market got into the spirit of Independence Day early, and created its own fireworks! In my last article, I concluded that the bulls could not declare victory just yet, and it must have struck a nerve because, starting on Monday, they decided to show me! The SPX was up strongly every single day, closing on its high at the end of Friday with a 71-point ramp for the week.
That may be just about all you get for now! Instead of following through next week, the odds are that equity indices will have to do a little consolidating before moving higher. We'll find out as early as Tuesday. After that, another limited move up before a deeper correction into the middle of the month, and the 9-mo cycle low. My thinking was that the SPX was making a correction in the form of a triangle. After last week, I am not so sure, but it could still happen. We'll have to see what the entire pattern looks like after mid-July.
There are some other factors which support my view: the weekly chart has not yet made a confirmed break out, and both the chart pattern and the indicators need to pull back before they can extend their moves.
The UUP (dollar ETF) may be making a triangle consolidation pattern before going to a new low. It looks like it's ready to embark on the "e" wave, which would temporarily send the market in the opposite direction.
The VIX looks like it's ready for a short-term rally; and then there is the MSCI, which responded to the market rally with a big yawn. That index has a pretty fair history of accurately calling the market moves ahead of time. There are more indications, but this is enough to show that I have some good reasons to think that, whatever pattern is made in the end, we may have to wait out the first half of July before resuming the rally.
Let's look at some charts!
Chart Analysis
We'll start with a simple "closes only" rendition of the Weekly Chart which, nevertheless, has all the information we need to see clearly the market position.
The bottoming 7 and 6-yr cycles caused the bear market and launched the bull market which is still in progress. There was an intermediate correction when the 2 and 4-yr cycles made their lows, and another, more recently, when the Armstrong 8.6-year (as part of a cycle cluster) made its low. The correction appears to have ended when the SPX found support on its main trend line and had a strong bounce.
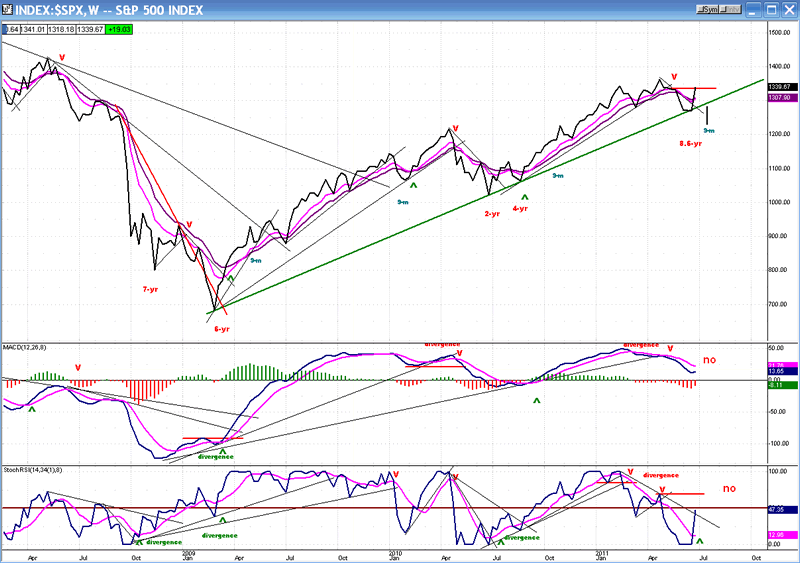
In spite of the notable rebound which the index experienced last week, we do not have a confirmation that the weekly trend has turned. In order to get it, the indicator and the price would have to rise above the red horizontal lines, and the MACD lines would have to cross. Since the 9-m cycle low is due mid-month, we will most likely see a minor pull-back into that time frame, and then resume the uptrend.
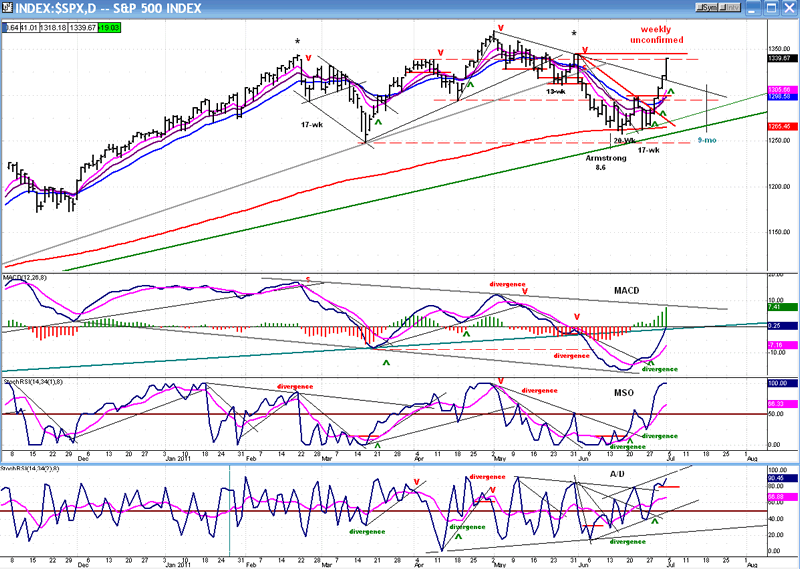
The picture is quite a bit different on the Daily Chart. Here, there is no question that a short-term uptrend is now in effect. All the indicators have given a buy signal, but the MSO is now overbought. Note that the A/D oscillator is lagging. The same indicator on the QQQ chart actually turned down on Friday, thereby showing negative divergence. That's a warning that a correction is imminent and will probably start on Tuesday.
Whether there is only a short consolidation and a continuance of the rally, or if it lasts into the middle of the month, the outcome should not be affected. The SPX is on its way to meet the intermediate projection which was forecasted by the 2009 P&F chart base pattern, and that was re-confirmed at every re-accumulation level on the way up, including the one that has just been completed.
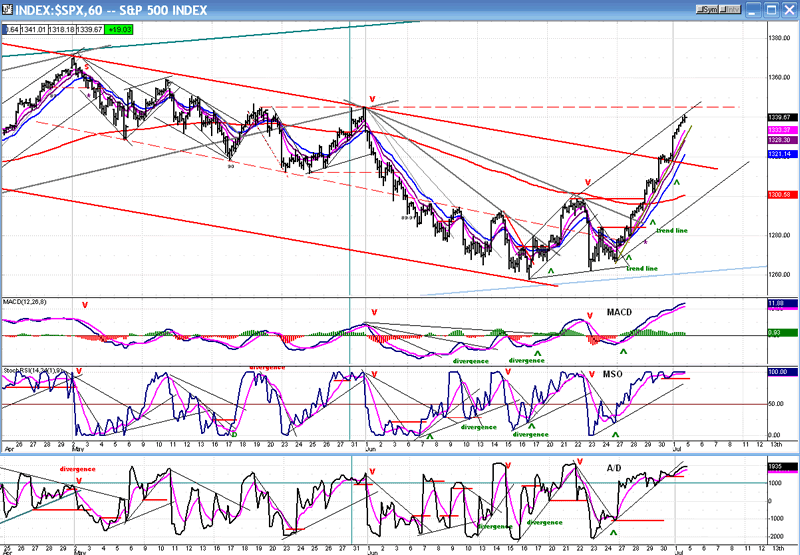
Let's now take a peek at the Hourly Chart to get a better feel for what may take place on Tuesday.
We have a short-term runaway bull which has become extremely overbought and which already had the basic technical conditions for a reversal on Thursday. In that day's Market Summary to subscribers, I wrote: "There is no sell signal, but the hourly indicators are almost begging for one". If that applied to Thursday, it applies doubly to Friday. All major indices have bullied past their initial P&F projection, but they fell just short of overcoming their last important near-term high. In the case of the SPX that would be 1345.20. Thursday and Friday presented an unusual set of bullish conditions to continue the rally: end of the month window-dressing, the first day of the month (which tends to be bullish), and a Friday before a long week-end which started the day with an economic report that provided some re-assurance that the economy was already rebounding.
The same conditions won't prevail on Tuesday, and short-term irrational exuberance may give way to more rational profit-taking. And because we are in a volatile period in which the rest of the herd tends to pile in behind the lead bulls or bears, there could be a sharp correction.
There is no question that the momentum indicators are stretched to their limits -- not just the hourly, but the daily as well, and a tell-tale sign that a pull-back is due may lie in the negative divergence that is showing in the daily QQQ A/D indicator. There is also some evident deceleration taking place in the hourly MACD histogram.
But if you are not convinced, wait until you see the condition of the SentimenTrader short-term indicator!
Cycles
There were strong indications that the nest of cycle lows which occurred the week before last (anchored by the Armstrong 8.6-yr cycle) would lead to a rally, but there was nothing that foretold a feeding frenzy of stocks. This rally was more pyranhic than bullish.
The 9-mo cycle which is due mid-month could put a temporary damper on the buying enthusiasm, but that's probably all that it will be. A reversal which starts with this kind of momentum tends to follow through for some time - unless it's a climactic blow-off, which is not the case here.
Breadth
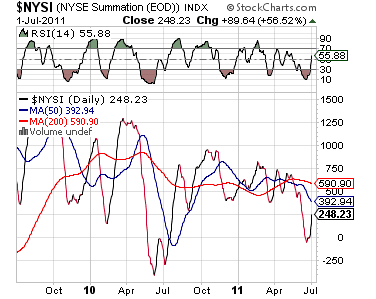
Last week, the Summation Index showed inklings of a potential reversal due to an arrest of the downside momentum in the indicator, and to a very oversold RSI. This week, we can see that the rally in the indicator lacks the strength that was exhibited by the market (we saw the same thing in the daily A/D indicators). This is one of the reasons I feel that a consolidation is likely before the SPX moves to a new high. If this lack of confirmation persists as the market moves higher and becomes negative divergence, we'll have a warning that we may be approaching a more serious market top.
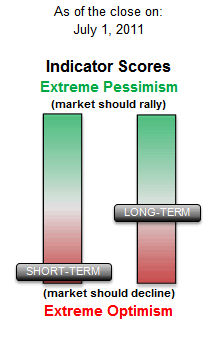
Sentiment:
The bull's White Knight in shining armor (The SentimenTrader, courtesy of same) came to their rescue magnificently last week but, in the process, got a little battered and turned shades of gray in the long-term indicator, and pitch black(red?) in the short-term. If this indicator has any predictive value at all, the market is ready for a pull-back.
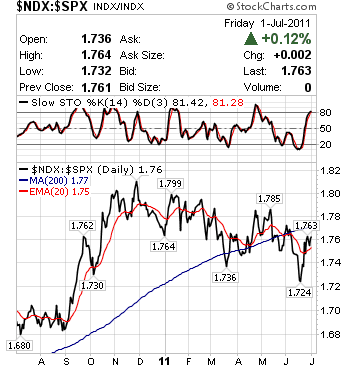
We'll also have to keep a sharp eye on the above index which tracks the performance of the NDX relative to the SPX. It does not show a convincing rally in support last week's bullish explosion. Along with the Summation index, this is another sign that the long-term market momentum is beginning to diminish.
As I mentioned last month, the first letter of the new month will analyze the dollar, gold, and oil. We'll start with the dollar in the form of its ETF, UUP.
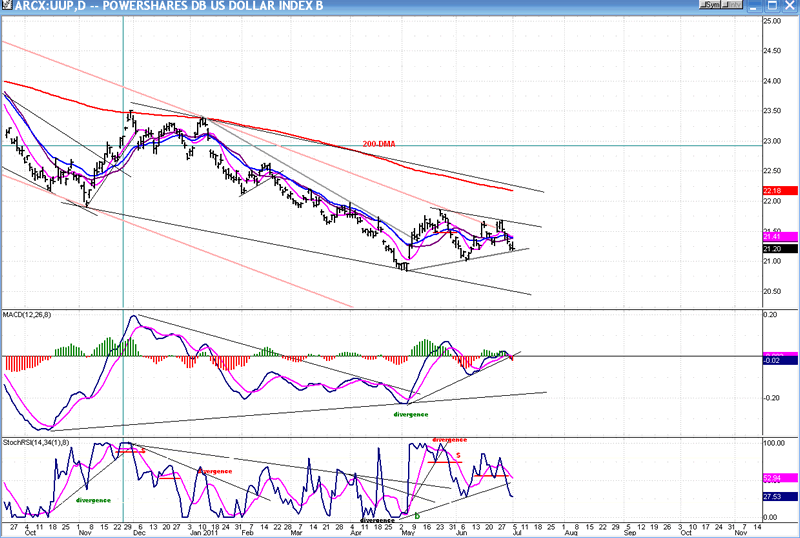
Dollar
The daily chart of UUP shows an index which has difficulty breaking out of its downtrend. It has now flirted twice with its intermediate trend line and failed, both times, to break through. This suggests that the dollar (or its ETF) may be ready to resume its downtrend - but not before having another short rally to complete the triangle consolidation pattern which appears to be forming. If this analysis is valid, it will make new lows after the pattern is complete. This is also suggested by the P&F chart which projects a potential decline to 73-71 for the dollar.
On Friday, UUP held its support trend line and was essentially unchanged for the day, while the SPX raced ahead to new highs. If the index does start to move up, it will be another reason for the equity indices to correct.
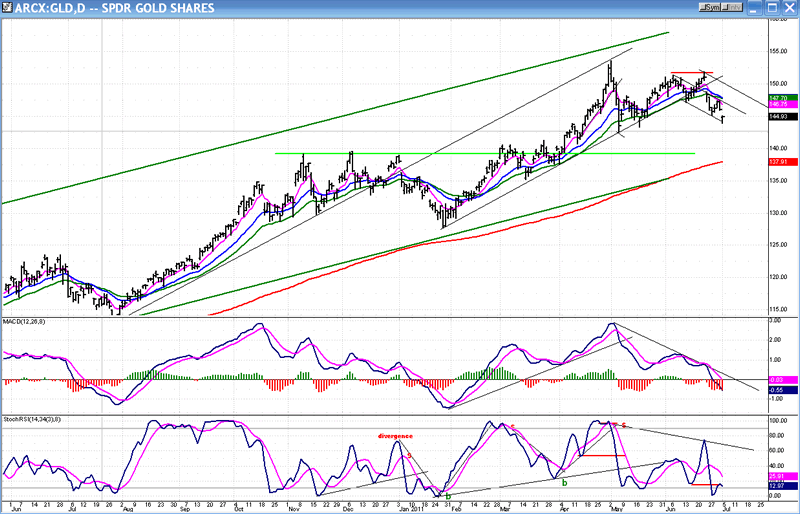
Gold
We'll now take a look at GLD, the gold ETF. After reaching its projection high of 153, GLD had a sharp correction down to 142.55, where it formed a small base and started rallying toward a 155 objective. It was cut short by the announcement that Greece was willing to submit to the austerity measures required to get an additional loan. The index may be broadening its base before making a new high, or it could be making a distribution top which will result in a larger correction. The short-term P&F pattern suggests a move down to 42-41. There is strong support starting just below 140 that corresponds to the rising 200-DMA and a long-term trend line. It's going to be a tough level to break!
Gold had a recent history of moving along with the equity indices. Will the current divergence continue, or is it a temporary phenomenon? Only time will tell.
OIL
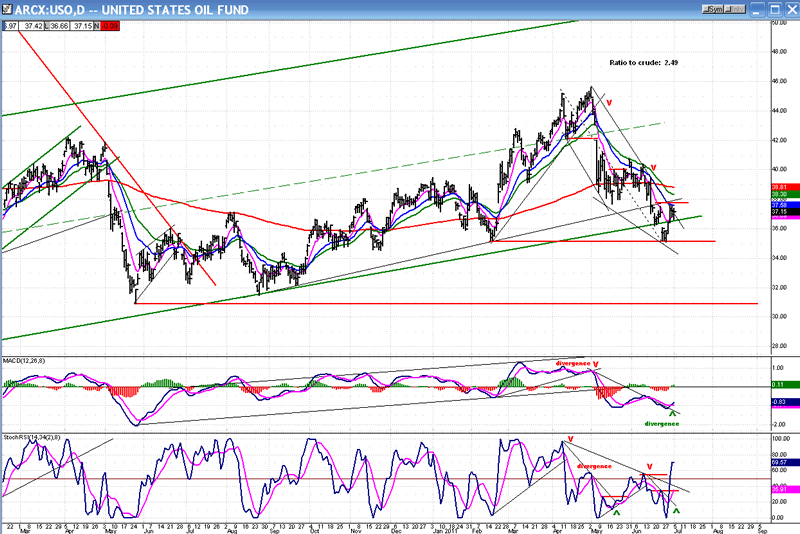
I am going to continue monitoring oil through USO. The light crude ratio to USO is 2.49. So, if I give you a P&F projection, all you have to do is to multiply that price by 2.49, and this will give you a projection for crude. The only Point & Figure chart for crude that I could find was that of WTIC, but it is an end-of-day chart which does not give accurate counts. USO appears to count well.
USO filled a short-term P&F count when it completed its downside correction at 36. This is a level where declining prices found support once before. There is no base established so, until one is built, an upside count from here is not possible.
Both of the indicators have given buy signals, suggesting that a short-term reversal may be taking place. However, it has not been confirmed by the price which still has to make a decisive penetration of its short-term downtrend line. Oil did not participate in Friday's rally extension.
When USO met the 46 target which had been discussed previously, it was only a phase projection. This could turn out to be an important high, but if an uptrend begins and get past 41, USO could be on its way to the next target of 52. (That corresponds to 130.00 for crude.)
Summary
The sharp advance which took place last week left the market very overbought on a daily and hourly basis. The odds favor a correction before trying to move higher. It should start when the index breaks its very steep minor uptrend line.
If the SPX fails to get past 1345 on the next rally, it could correct for a couple of weeks, influenced by the 9-mo cycle which is scheduled to make its low mid-July.
After the correction is over, it is likely that the index will resume its uptrend and make a new high --probably in the vicinity of 1400.
FREE TRIAL SUBSCRIPTON
If precision in market timing for all time frames is something which is important to you, you should consider a trial subscription to my service. It is free, and you will have four weeks to evaluate its worth.
For a FREE 4-week trial. Send an email to: ajg@cybertrails.com
For further subscription options, payment plans, and for important general information, I encourage you to visit my website at www.marketurningpoints.com. It contains summaries of my background, my investment and trading strategies and my unique method of intra-day communication with Market Turning Points subscribers.
By Andre Gratian
MarketTurningPoints.com
A market advisory service should be evaluated on the basis of its forecasting accuracy and cost. At $25.00 per month, this service is probably the best all-around value. Two areas of analysis that are unmatched anywhere else -- cycles (from 2.5-wk to 18-years and longer) and accurate, coordinated Point & Figure and Fibonacci projections -- are combined with other methodologies to bring you weekly reports and frequent daily updates.
“By the Law of Periodical Repetition, everything which has happened once must happen again, and again, and again -- and not capriciously, but at regular periods, and each thing in its own period, not another’s, and each obeying its own law … The same Nature which delights in periodical repetition in the sky is the Nature which orders the affairs of the earth. Let us not underrate the value of that hint.” -- Mark Twain
You may also want to visit the Market Turning Points website to familiarize yourself with my philosophy and strategy.www.marketurningpoints.com
Disclaimer - The above comments about the financial markets are based purely on what I consider to be sound technical analysis principles uncompromised by fundamental considerations. They represent my own opinion and are not meant to be construed as trading or investment advice, but are offered as an analytical point of view which might be of interest to those who follow stock market cycles and technical analysis.
Andre Gratian Archive |
© 2005-2022 http://www.MarketOracle.co.uk - The Market Oracle is a FREE Daily Financial Markets Analysis & Forecasting online publication.