


Gold Continues to Target a Downtrend to $1400
Commodities / Gold and Silver 2011 Jul 03, 2011 - 10:47 AM GMTBy: Merv_Burak

 So far the head and shoulder pattern in gold, highlighted here for the past couple of weeks, is acting right on schedule. If all continues to perform as expected then we are heading towards the $1400 area. BUT seldom do things go as expected. Go with the flow but always be prepared for the unexpected.
SIMPLETON
One advantage a simple market technician has over just about every other analyst is that he (or she) can express the market activity in simple terms without having to get too technical, when you inevitably loss most readers. More importantly, a simple market analysis is just about as good as one based upon super sophisticated algorithms and language sprinkled with high sounding words and philosophies.
This is Canada’s 144 year birthday and the U.S. July 4th weekends. Everyone is in relaxation mode so let’s quickly go with the simple and get back to celebrations.
As a simple technician I basically look at three things to determine where we are in the market: trend, strength of trend (momentum) and volume activity behind the trend.
GOLD
LONG TERM
Trend: Gold is above its positive sloping long term moving average line for a positive long term trend. Gold is moving aggressively towards its long term moving average line but the implications will be first noted in the shorter term periods.
Strength: There are dozens of different momentum indicators one can use to gauge the strength of the existing price move. For my commentaries I like to use the Relative Strength Index (RSI) using an appropriate time period chart. The long term momentum indicator is still in its positive zone but is now below its negative sloping trigger line. The indicator is heading lower fast but still has some to go before it crosses below its neutral line.
Volume: As for the volume indicator, I use the popular On-Balance Volume indicator. It is still in a positive mode above its positive long term trigger line.
Putting the above information into my secret simple formula I get an existing rating for the long term as BULLISH.
INTERMEDIATE TERM
The process here is the same as that for the long term except for the use of appropriate time period indicators and trigger lines.
Trend: Gold dropped below its intermediate term moving average line last week and has remained there throughout this past week. The moving average line has now turned to the down side.
Strength: The intermediate term momentum indicator remains in its positive zone but barely so. It is moving lower fast and could cross into its negative zone with one more negative market action day. The indicator it below its trigger line and the trigger is in a negative slope.
Volume: The volume indicator has just crossed below its intermediate term trigger line although the trigger is still sloping upwards.
Putting all this together we get an intermediate term rating of BEARISH. To confirm the intermediate term I also look at the next lower time period moving average line. The short term moving average line has now crossed below the intermediate term line for confirmation of this bear.
SHORT TERM
One chart is as good as a thousand words but of course I need to put in the thousand words (or so) or else there is no justification for this commentary, so here goes.
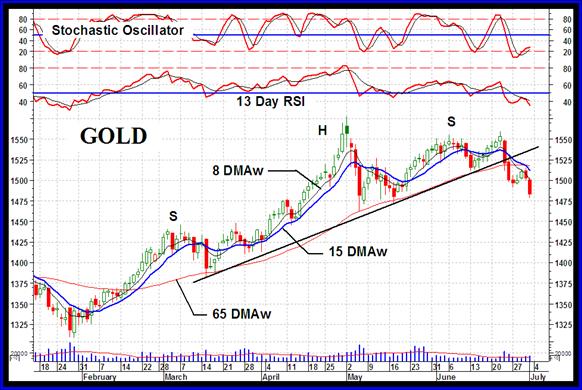
The head and shoulder pattern I had mentioned in the past can be clearly viewed on the chart. It is a steeply sloping shoulder construction but still a valid chart. It meets the criteria I use for a head and shoulder pattern (mentioned here a couple of weeks back). Let’s go through the routine to see where the market stands for the short term.
Trend: Gold closed below its negatively sloping short term moving average line. It looks like it wants to continue the negative trend.
Strength: The short term momentum indicator is in its negative zone and moving lower. It is also below its negative sloping trigger line.
Volume: The daily volume action remains on the low side. This does not confirm or negate any particular trend. Trends do not usually depend upon market players staying on the side lines but depends upon players either jumping on a bullish or bearish bandwagon.
For the short term I don’t even have to go to my secret formula, the short term position of the gold activity is BEARISH. This is confirmed by the very short term moving average line remaining below the short term line.
As for the immediate direction of least resistance, I’ll go with the down side. The trend seems to be in that direction and the Stochastic Oscillator, which had started a rally of sorts, is once more turning to the down side although not quite there yet.
SILVER
Let’s go through the same routine for silver as we did for gold. Silver is still acting weaker than gold as can be seen by the info in the Technical Table at the end if these commentaries.
LONG TERM
Trend: Silver has just dropped below its long term moving average line although the line itself is still very, very slightly sloping upwards. There is a support at the $33 level and a move to the $32 level would be bearish from several different indicators, including my long term point and figure chart.
Strength: The long term momentum indicator remains in its positive zone but is below its negative sloping trigger line. The price support comes from activity in mid-May. The momentum indicator is already below its mid-May support level.
Volume: The volume indicator has been moving sideways for two months now and is resting right on top of its long term trigger line. The trigger is still in a very slight upwards slope.
Unfortunately, my secret formula tells me the long term position of silver is BEARISH. The Table rating is also bearish (NEG) confirming the visual analysis, which is not always the case since there are a few differences in their indicators.
INTERMEDIATE TERM
Trend: Silver dropped below its intermediate term moving average line in early May, during the plunge, and remains there. The moving average line continues in a downward slope.
Strength: The intermediate term momentum indicator has been oscillating above and below its neutral line for two months now. On Friday it was back below the line in the negative zone. It is also below its negative sloping trigger line.
Volume: As with the momentum, the volume indicator has been moving sideways and oscillating above and below its intermediate term trigger line for a couple of months. As of Friday it is below its trigger line and the trigger is very, very slightly sloping downward.
The only rating I can give for the intermediate term is a BEARISH rating. The short term moving average line confirms this bear by remaining below the intermediate term line.
SHORT TERM
Trend: On the short term we are inside a downward sloping channel with lower highs and lower lows. Silver staged a very weak bounce during the week but went nowhere. It is once more below its short term moving average line and the line remains sloping downward.
Strength: The short term momentum indicator has been moving sideways for the past two months but below its neutral line in the negative zone. It has once more dropped below its trigger line and the trigger is pointing downward.
Volume: As with gold, the daily volume action remains very low and not really giving us any significant information.
For the short term the rating remains BEARISH. The very short term moving average line confirms this bear as it remains below the short term line.
As for the immediate direction of least resistance, it is too easy to say the downward direction. However, the Stochastic Oscillator has not given any real view that it is turning back towards the down side and the price of silver is still slightly above its low from a couple of days back. The Friday close is $37.71. A close below $37.58 will suggest the immediate direction continues lower.
PRECIOUS METAL STOCKS
Two weeks ago I showed the most popular North American Gold Index, the PHLX Gold/Silver Sector Index. I was going to show the Merv’s Gold & Silver 160 Index last week but power failures put that aside for a week. Today I show the Merv’s Index for comparison of performance.
First thing one notices in comparing the two Indices is that there is almost no comparison. The PHLX Index is below its high reached in early 2008 while the 160 Index is some 75% above its 2008 high. As I have mentioned so often, one Index is based upon the performance of a few large companies while the other is based upon the average performance of the 160 component stocks. The smaller stocks are producing by far the greatest performance in the 160 Index.
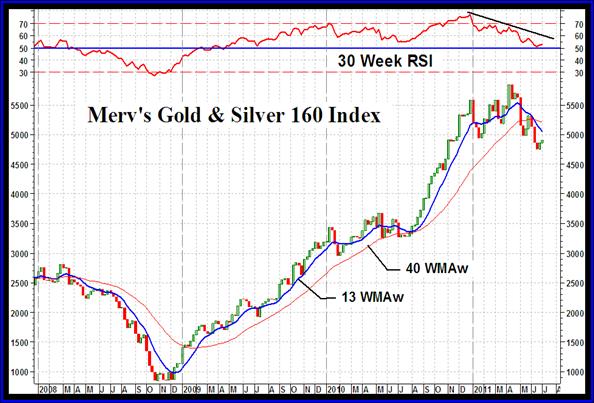
Both Indices are below their long term moving average lines but the long term momentum indicator for the160 Index has still not dropped into its negative zone. It is, however, showing weakness and it could drop into the negative any week.
I show these two Indices to suggest that one should take, with a grain of salt as they say, any analysis based upon the major North American Indices. They DO NOT represent the actions of most precious metal stocks but just the actions of a few of their higher weighted component stocks. I guess that any Index is, however, better than none.
Next week, the Merv’s Penny Arcade Index. What I have been warning about the actions of this Index seems to be coming due.
Merv’s Precious Metals Indices Table
Well, that’s it for this week. Comments are always welcome and should be addressed to mervburak@gmail.com.
By Merv Burak, CMT
Hudson Aero/Systems Inc.
Technical Information Group
for Merv's Precious Metals Central
For DAILY Uranium stock commentary and WEEKLY Uranium market update check out my new Technically Uranium with Merv blog at http://techuranium.blogspot.com .
During the day Merv practices his engineering profession as a Consulting Aerospace Engineer. Once the sun goes down and night descends upon the earth Merv dons his other hat as a Chartered Market Technician ( CMT ) and tries to decipher what's going on in the securities markets. As an underground surveyor in the gold mines of Canada 's Northwest Territories in his youth, Merv has a soft spot for the gold industry and has developed several Gold Indices reflecting different aspects of the industry. As a basically lazy individual Merv's driving focus is to KEEP IT SIMPLE .
To find out more about Merv's various Gold Indices and component stocks, please visit http://preciousmetalscentral.com . There you will find samples of the Indices and their component stocks plus other publications of interest to gold investors.
Before you invest, Always check your market timing with a Qualified Professional Market Technician
Merv Burak Archive |
© 2005-2022 http://www.MarketOracle.co.uk - The Market Oracle is a FREE Daily Financial Markets Analysis & Forecasting online publication.
Comments
|
dincer
04 Jul 11, 03:41 |
Support levels
Probably gold will bottom this month at 150 MA support as usual. If 150 MA does not hold, 61,8 fibonacci support at $1410-11 will remain intact. |