


Stock Market On a Roll, FX Correlations
Stock-Markets / Stock Markets 2011 Jul 02, 2011 - 02:21 PM GMT

 Impressive is the best word to describe the rally, in what has became one of the biggest 5 days rallies in history, I had to go back to Nov 2005 to find anything remotely like it, although I was actively looking for the reversal. (read the last 2 articles) to see such a huge rally like that, I think blew most traders away, hence the word impressive gets randomly used, but in this case it fits well.
Unless you have been living in a cave for the past few days, the market has made mince meat of traders that never respected the trend change, its only after 3-4 days that traders are finally accepting the trend has changed.
The ironic thing is the trend never really actually changed from being a bullish trend to a bearish trend, simply because it never got much under the 200DMA in the major US markets, respecting what price does always will be the key most important factor, and ignoring that is a flaw that many traders still won't accept when they are wrong.
Trying to get short in the face of a 70 handle rally, is suicide, as until the trend actually showing some evidence of a reversal, you are simply trying to top tick a reversal.
Is it better not to wait for a clue to a trend reversal 1st? then initiate positions, I wrote about using 1280SPX as our key bull/bear line, as that the bears would need to respect any move above but whilst under the market was a sell.
"If we were to see a strong move that pushes above 1280SPX then 1300SPX we would have to consider other options, but getting above 1280SPX is the 1st clue for the bears to be cautious off."
I personally never really considered the bearish idea of substantially lower prices, yes it was always an option, but until price broke under the 200DMAs on the major US markets, then only then could we consider a bearish idea. The European markets such as the FTSE and DAX has setups that I wanted to respect. See previous articles
The past few weeks, ever since I proposed those ideas about new yearly highs, I was getting e-mails, telling me that my ideas were wrong and the market was about to crash, and I was completely nuts for thinking about this market going higher because no more QE2.
If traders had noticed the clues I had noticed, then this rally should not of been a surprise, look to the treasury market to see where the money came from, yes ZB & ZN experienced one the worst declines in history, this is where the money came from, I wrote about this is past issues, that to watch the treasury complex as money out of ZN & ZB will go straight into stocks, this is exactly what happened. You don't need QE when money moves from one place to another.
Yes the markets possibly could have crashed, but my work at that time was telling me, that was not likely the case and that if you were bearish at the lows looking for some super decline, then not to bet the kitchen sink on it, as I felt the case that a strong reversal could be setting up, based off those patterns in the FTSE and DAX. Going it alone against the majority of traders is something I have done before, and I will do so again, if the patterns suggest it.
I only hope the traders than sent me the bunch of hate mail, respected the move above 1280SPX and not caught out from the vicious rally, as that sort of move breaks accounts, it surprised me, even though I was looking for it.
With the market pushing back above 1280SPX, there was still the potential of a push lower, but the market failed to get back below 1280SPX, and buyers stepped up and pushed the tape higher, being above 1280SPX was the 1st clue, to step aside if bearish, but then being above 1300SPX further added to the confirmation. It's only now I think that traders have finally accepted the truth about the move.
Remember weeks before we were net sellers against 1280SPX on the decline from May 2011 highs, and it was our bull/bear line in the sand and something that we were going to respect the direction from.
Throughout this week I was reading all sorts of ideas about why this market has rallied, ideas ranged from Greece bailed out, to short interest etc, no volume ramp up etc.
The bottom line is and always has been, price is all that matters.
Volume never really makes much difference as price can move for far longer periods than you think, just the same with indicators and sentiment readings.
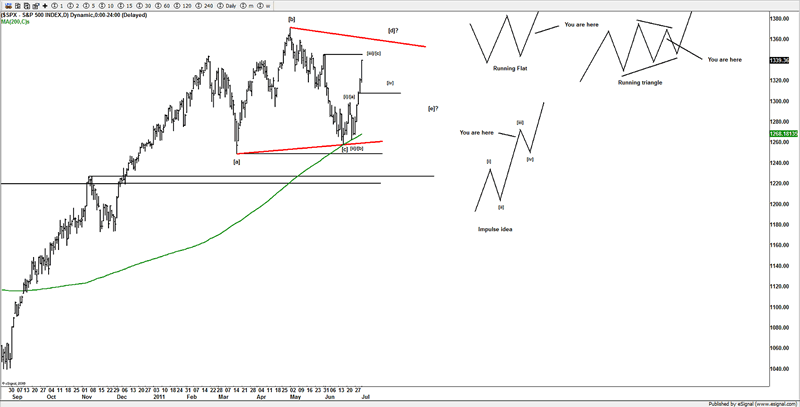
SPX
So where does that leave us with the ideas from the past few weeks, with such a big reversal, we really should see a pullback soon, but I was thinking that for the past 2 days, only to see more buying interest come into the market.
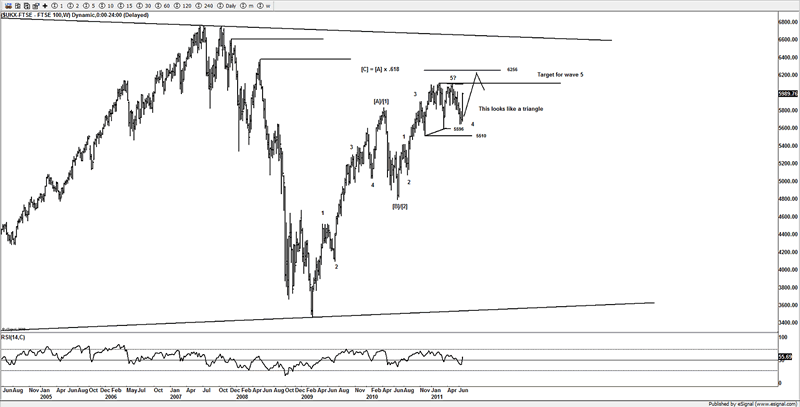
From the lows, atm we have 3 waves, but the recent explosion looks more like a 3rd wave than a C wave, but I will respect the potential for the triangle idea, although we could easily seen a running flat at the last swing low, to marry up with the NDX.
From the last low, there is a clear 3 wave rally, but the move looks more like a 3rd wave, but it could be part of a sharp wave [d] of a triangle, or part of an impulse wave, but until a correction, can we confirm if wave [iv] for an impulse wave, or wave [e] of the triangle idea on the next dip/pullback.
If the market is working the impulse wave idea, I suspect a pullback towards 1313-1315SPX, for a wave [iv], if the triangle idea is working, and wave [d] is near its conclusion, then a sharp nasty move towards 1300-1280SPX for wave [e] could be seen to scare a load of bulls that buy into the rally at the highs, as I am sure many will be wanting to get into this rally, just like they got into the rally at 1370SPX.
So the safe trade now is to wait for a pullback, although it feels like it will never happen, it will happen, based off the pullback, we can then work out what's the likely option is, of course the market could completely reverse, as there is also a potential H&S setting up, yes I see that as well, but again I will deal with that idea, if I see evidence to support a bearish setup, right now the tape is bullish and traders should give the benefit to the bulls, if I see bearish price action that negates any bullish idea, then sure we will switch bias, but until that happens, I suggest staying with the current move.
So its important on the next pullback to work out for the ideas based off that dip, I don't suggest chasing now if you're not already long, as the best part of the move has likely gone.
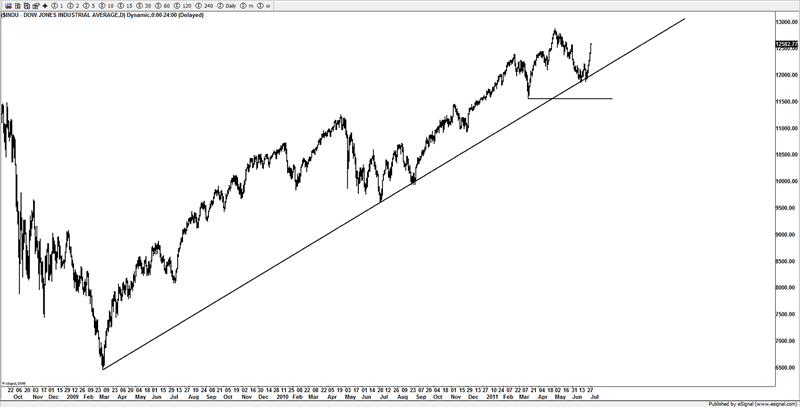
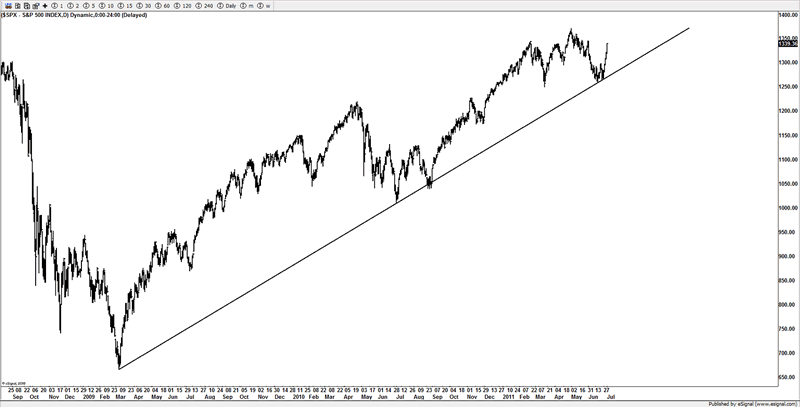
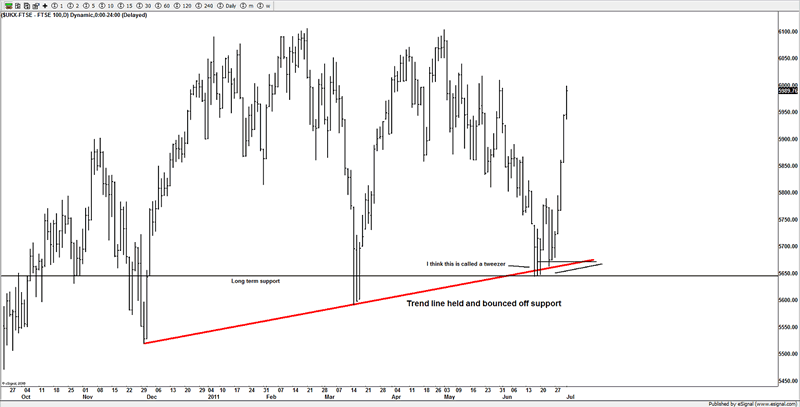
I posted these to members as they hit the trend line 2 weeks back, but they have held well and the bull market continues higher.
FX correlations
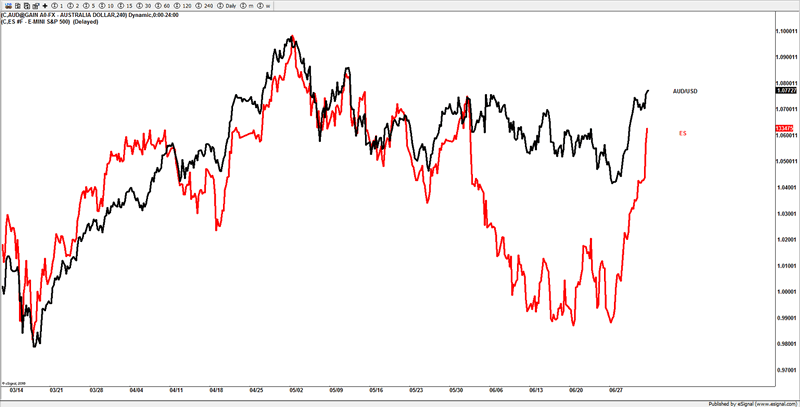
Correlations play a huge part of my work, and in order to watch what stocks are doing, you need to closely track 2 FX pairs that can help navigate the contours of what stocks are potentially going to do.
If you want to follow the ES/SPX, you need to look to the AUD/USD and USD/CAD pairs, as they track the ES with a very high correlation, so as I count and watch those pairs, they offer clues to where stocks potentially are going.
If you look at an overlay of the 6C contract with the SPX, you can see that it plays to watch those crosses (6C is the futures contract for the Canadian dollar, basically CAD/USD).
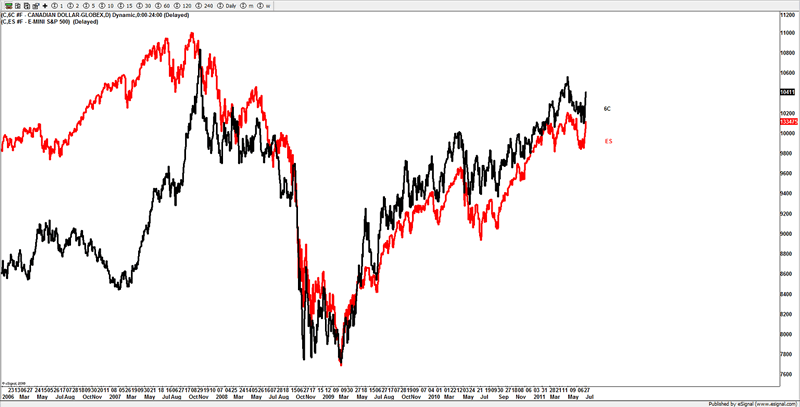
You can see how highly correlated this pair is to the ES, and if you look at the USD/CAD pair, it found rejection right at its 200DMA just as the SPX found support as its 200SPX (ES is the SPX futures).
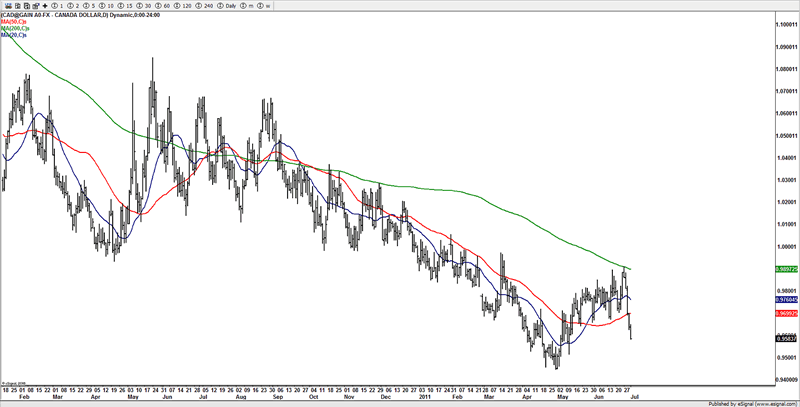
So if the USD/CAD pair is about to push lower to make new yearly lows (i.e. 6C to new yearly highs) then surely it suggests that stocks will push to new yearly highs?
Well that's the message that appears to come across to me, and until the idea is busted and we see above the 200DMA on USD/CAD and below the 200DMAs on the US markets, the trend is still to be considered going higher in stocks.
In today's markets its vital to look at many parts of the puzzle and not fix yourselves to a perma- bias be it bull or bear.
When you see pairs such as the AUD/USD rallying aggressively and the USD/CAD simply in crash mode, there is simply no way you can step out in front of the move you saw in stocks, that is akin to jumping in front of a freight train.
Yes you should see a pullback from here, but if fits in with the overall bullish "risk on" set ups, then traders should use it for buying, and embracing the bullish side of the market, only until this market gives reasons to consider bearish ideas, do traders want to look to a substantial decline.
I lost count the amount of time trades have got bearish on these markets at the lows only to see a "rip your face off rally".
10 handle rule
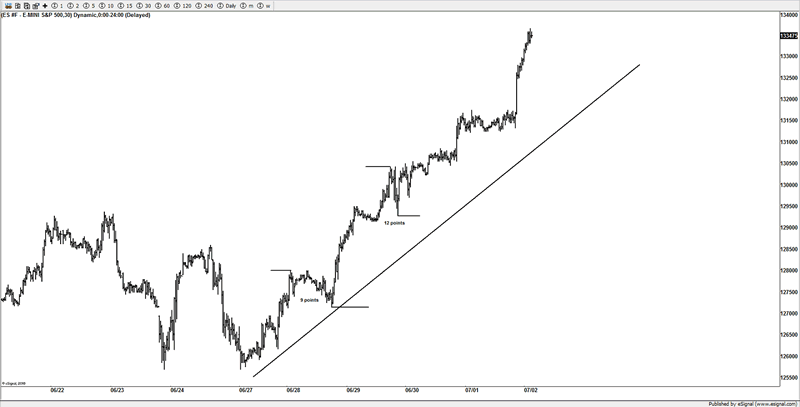
There is a great rule for helping decide if momentum is still staying with the current trend, and one such useful clue is the 10 handle rule.
What that simply means that on any trend, be it up or down, you look to decide what the current trend is, then watch to see if bounces or dips are contained via 10 handles, it can see some noise, to I like to give it a bit of leeway 2 handles but in general the 10 handle rule works well in trends.
If you look at the current trend over the past 5 days, you can see that only on 2 occasion have we see such an occasion, but go back to those rallies we saw in 2010, and you can use this and find that most dip were contained inside the 10 handle rule. It's a great trick for staying on the right side.
If you see impulsive price action more than 10 handles, then you can be on guard for a reversal, but as the shorts were throwing themselves under the freight train this week, only one look at this chart would have told you to stay away from selling the trend over the past 5 days.
So until this actually dips more than the previous fractals, I have to ask why traders are throwing themselves in front of the train here? When there are no clues to a reversal.
Those that try and top tick generally get burnt, it's far better to wait for confirmation before pressing the trigger.
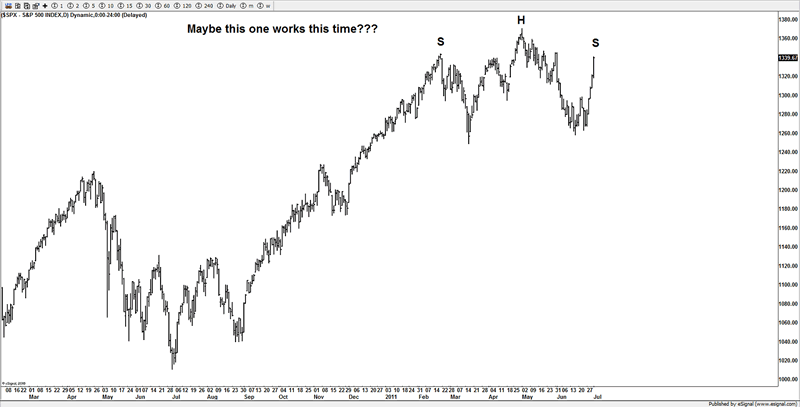
Head & Shoulders
If I did not post this chart, I would not want readers to think I was a perma bull, yet I have mentioned in these pages that staying under 1280SPX was a bearish sign, that's clearly old news as the market has confirmed its bullish intentions, but there is this pattern, but I am so sure readers will see this in loads of articles, I wonder if it's going to be as worthless as a chocolate teapot, as I suspect too many traders are looking for this setup as well, but maybe markets might finally see one of these H&S bearish patterns play out, I don't recall one working for the past 2 years.
Be careful about trading with the masses, as you have just seen, when most are on the wrong side, you see a vicious snap back, I also suspect that many are looking to trade this setup and may have initiated more short positions, that can be the fuel to drive this market far higher.
FTSE
Still looking for that new yearly high, and this week was a great start to that idea, although we do have a cluster of resistance at 6000-6030, we used that area on the prior months to sell against, as it's been a real star, and many sell side setups were taken from that area. So a reaction from that area is the suspected pullback spot, it's what happens after that, like we see on the US markets, that will help us going forward, members will have access to the short term charts for ideas going forward and knowing where the ideas are wrong, which will keep us on the right side of the trends.
I am sure the level of bullish will be intense at the highs, just as I would be expecting to look for a bearish reversal, the market never changes, traders are bullish at the high and bearish at the lows.
So targets are new highs from here, (subject to near term price structure) but we are a few points away.
As long as my key supports areas are not invalidated, then I will continue to work this idea. Members will know those areas, and we will respect those should the market reverse hard to the downside from here.
I don't have a problem being wrong with any idea that's what stops are used for, hence I use Elliott for stop placement, those that use Elliott objectively, don't fall into the traps of forced labeling I commonly see from the permabear Elliotticians, as being wrong is a natural process, being wrong and stubborn is what hurts traders.
DAX
Same ideas as before working the 5th wave of the ending diagonal (ED) to new yearly highs, it will need something special from the bears to reverse the current moves we witnessed over the past few days.
Potentially I think in the ED is the better option, but as shown via the red lines the option of a triangle is there, but they are virtually the same sort of patterns, so baring a complete reversal of what we just witnessed on the markets, I am still looking higher.
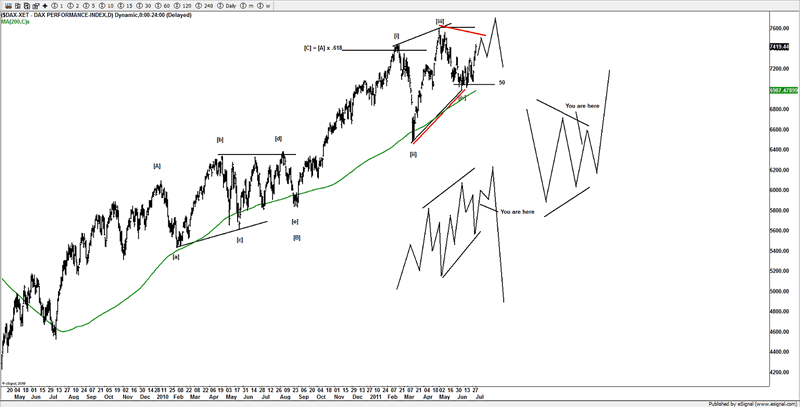
I posted in an article 2 weeks back, about the divergence in the DAX and how it failed to get under the 7000 area, well the divergence, actually was a VERY important clue for those that actually looked with a clear mind and not looking for a crash, the DAX was telling us the story.
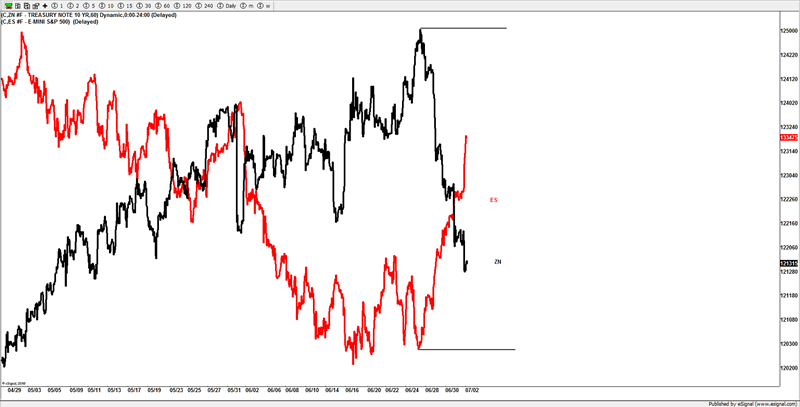
ZN (10 Year)
As you can on this chart, the money flowed straight out of treasuries into stocks, simply because treasuries were deemed to be expensive after the huge rallies we had seen, and stocks are cheaper, so buying stocks after the decline makes sense, and dumping US treasuries saw those traders move money into US stocks.
Silver
Still looking at the $30 area, rejection this week at the trend lines is a telling sign, that the bulls are not around in strength, we are keeping the door open for a move to test the 20DMA again, but the weakness in gold and silver, is helping the "risk on" trade, as traders are not buying into the metals for safety as the world has not ended just yet, and buyers in stocks are back out in force.
Now if I do get to see those ideas on US and European stocks play out, then depending how silver and gold look, there could be potential buying opportunities in the future, but right now, I don't have any desire to catch a falling chainsaw, and selling bounces under key resistance is continues to be the safer trade, I will leave the bottom catchers to fight it out.
A big push above the 20DMA and the bears need to be cautious of a something bullish, but whilst under these trend lines selling bounces is the trade atm.
Conclusion
After a shaky start the markets have finally done what I expected them to, it's not been as clean or a text book as I would have liked, but the market never does make it easy, but respecting our 1280SPX area, is what was important to me and members, after selling against it, we needed to buy above it.
The overall rally has been impressive to say the least, seeing the collapse in treasuries was the trigger and as I suspected the money is going from treasuries into stocks, so there is not a need for QE to see those new yearly highs.
The markets now I think are technically based, so the momo stops when trader's buyers stop outweighing the selling pressure.
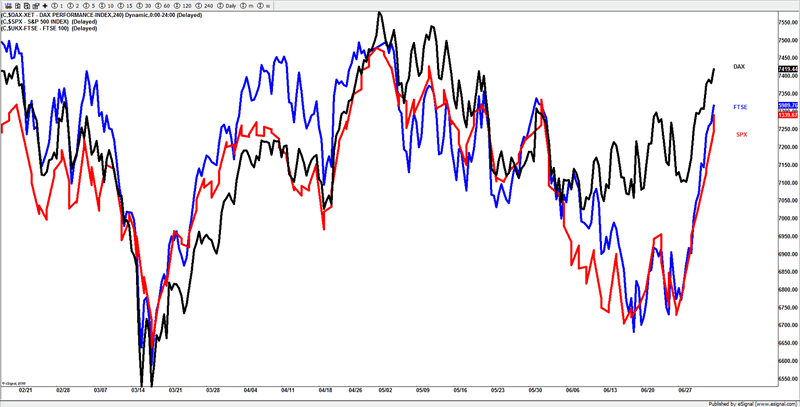
If the markets suddenly turn here then we will reverse our bias, only when we have confirmation of that, as we are in a range as seen on the SPX and FTSE, but as mentioned in last week's article, I will never terminate a pattern or idea until I get proof.
Some could say I have an answer for both directions, and that's correct. As traders of the market, that's what you need to do, have plans in case things go wrong, know where the ideas are right and wrong.
Stay nimble and respect what price does, if you get into a situation that causes you confusion, then take a step back and think about it. If you don't like a market, move to another one that looks a better setup, that's what we do.
The target was and still yearly highs, I am not looking for a super bull market from here, just new yearly highs, I expect the bullishness to be silly and the same levels at the 1370SPX highs when Osama was killed.
Subject to completed looking patterns, then I will look to be aggressively bearish just as the last buyer buys.
Price and patterns rules, it's how its interpreted that makes the difference. That comes from the user who stays objective.
The markets are moving well, and those are actively looking and coming up with ideas are enjoying the benefits.
Corn and silver continue to do what I expect, so are a couple of markets that I and members are looking to get involved in next week.
Some of the FX pairs, like EUR/CAD have been a real winner, the past week alone.
Lastly I would like the wish US readers of this article a happy 4th of July Independence Day and enjoy the time with your families.
Until next time.
Have a profitable week ahead.
Click here to become a member
You can also follow us on twitter
What do we offer?
Short and long term analysis on US and European markets, various major FX pairs, commodities from Gold and silver to markets like natural gas.
Daily analysis on where I think the market is going with key support and resistance areas, we move and adjust as the market adjusts.
A chat room where members can discuss ideas with me or other members.
Members get to know who is moving the markets in the S&P pits*
*I have permission to post comments from the audio I hear from the S&P pits.
If you looking for quality analysis from someone that actually looks at multiple charts and works hard at providing members information to stay on the right side of the trends and making $$$, why not give the site a trial.
If any of the readers want to see this article in a PDF format.
Please send an e-mail to Enquires@wavepatterntraders.com
Please put in the header PDF, or make it known that you want to be added to the mailing list for any future articles.
Or if you have any questions about becoming a member, please use the email address above.
If you like what you see, or want to see more of my work, then please sign up for the 4 week trial.
This article is just a small portion of the markets I follow.
I cover many markets, from FX to US equities, right the way through to commodities.
If I have the data I am more than willing to offer requests to members.
Currently new members can sign up for a 4 week free trial to test drive the site, and see if my work can help in your trading and if it meets your requirements.
If you don't like what you see, then drop me an email within the 1st 4 weeks from when you join, and ask for a no questions refund.
You simply have nothing to lose.
By Jason Soni AKA Nouf
© 2011 Copyright Jason Soni AKA Nouf - All Rights Reserved
Disclaimer: The above is a matter of opinion provided for general information purposes only and is not intended as investment advice. Information and analysis above are derived from sources and utilising methods believed to be reliable, but we cannot accept responsibility for any losses you may incur as a result of this analysis. Individuals should consult with their personal financial advisors.
© 2005-2022 http://www.MarketOracle.co.uk - The Market Oracle is a FREE Daily Financial Markets Analysis & Forecasting online publication.