


How A Credit Market Prices In Economic Recession
Stock-Markets / Financial Markets 2011 Jul 01, 2011 - 03:42 PM GMTBy: Tony_Pallotta

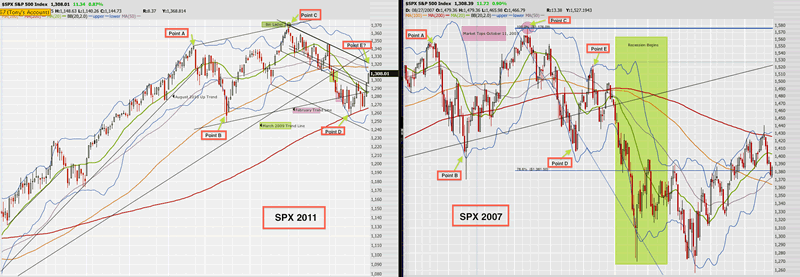
 In a prior post I compared the 2007 SPX topping pattern to the current May 2011 high. The assumption being the US economy is on the verge of an economic recession now as it was in December 07 when the recession officially began. The similarities were unquestionable (chart below). The unknown is are we building point E. Those believing recession is at hand will say yes, those saying it is a soft patch will say no.
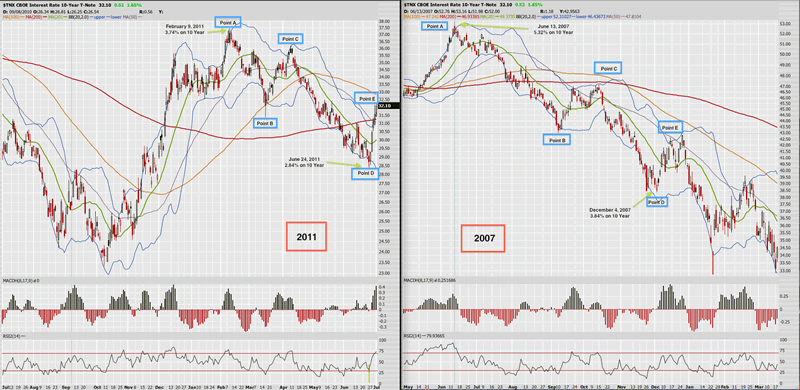
Well what do the credit markets say and what explains this 40 basis point move in the 10 year. The end of QE1 actually showed yields falling so history would be on the side of the bond market catching a bid versus the relentless selling going on this week. Well the comparisons with the 10 year treasury in the second half of 2007 and the current period are again striking similar. Equally striking is that we have precedence for such a parabolic move in the 10 year yield.
Point A in 2007 saw the 10 year peak at 5.31% on June 13, 2007, exactly four months before the SPX peak. Point A in 2011 saw the 10 year peak at 3.74% on February 9, 2011 exactly three moths before the SPX peak.
Point B in both instances saw a major move lower in yield.
Point C saw a sharp rebound in yield only to commence another major move lower.
Point D in both cases has coincided with the final ramp job in equities before the real selling finally began (unknown for 2011).
Point E in 2007 was as parabolic then as it has been this week with the 10 year moving up 40 basis points in 10 calendar days before commencing yet another major move lower in yield.
As of this post the SPX is testing the backside of the 2009 up trend (granted this line can be drawn multiple ways) which for someone seeing economic recession around the corner would find this a pleasant location for Point E.
By Tony Pallotta
Bio: A Boston native, I now live in Denver, Colorado with my wife and two little girls. I trade for a living and primarily focus on options. I love selling theta and vega and taking the other side of a trade. I have a solid technical analysis background but much prefer the macro trade. Being able to combine both skills and an understanding of my "emotional capital" has helped me in my career.
© 2011 Copyright Tony Pallotta - Disclaimer: The above is a matter of opinion provided for general information purposes only and is not intended as investment advice. Information and analysis above are derived from sources and utilising methods believed to be reliable, but we cannot accept responsibility for any losses you may incur as a result of this analysis. Individuals should consult with their personal financial advisors.
© 2005-2022 http://www.MarketOracle.co.uk - The Market Oracle is a FREE Daily Financial Markets Analysis & Forecasting online publication.