Leading Indicators: Part 1- U.S. Economic Health is Weakening
Economics / US Economy Nov 27, 2007 - 11:43 AM GMTBy: Donald_W_Dony

 After almost five years of easy continuous expansion, the cracks are beginning to show in the U.S. economy. From a failing U.S. dollar to deep investor fears in the housing market to ever louder concerns over the twin deficits. This article examines three key indicators and their implications in 2008.

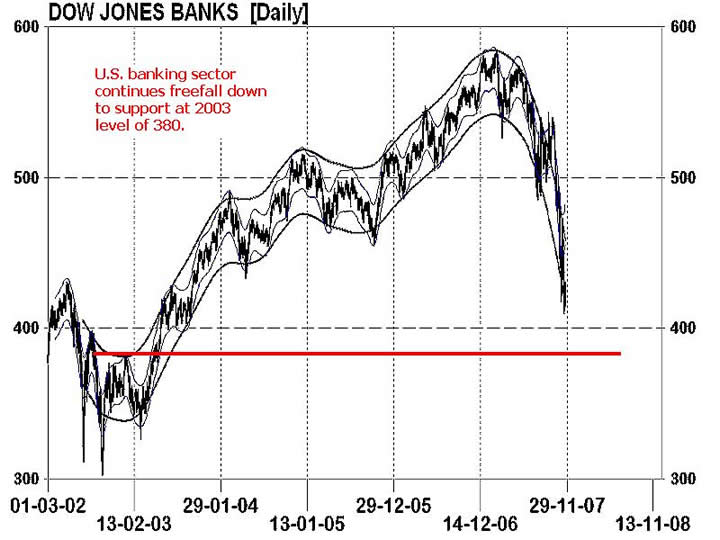
The U.S. banking sector has always been an important leading indicator on the economy and the stock market. But with the waterfall drop that the Dow Jones Bank Index (Chart 1) has displayed since January, many traders and investors are concerned about the near-term future health of the economy. This vertical plunge down to levels not seen since 2003 draws into question the sustainability of the present bull market.

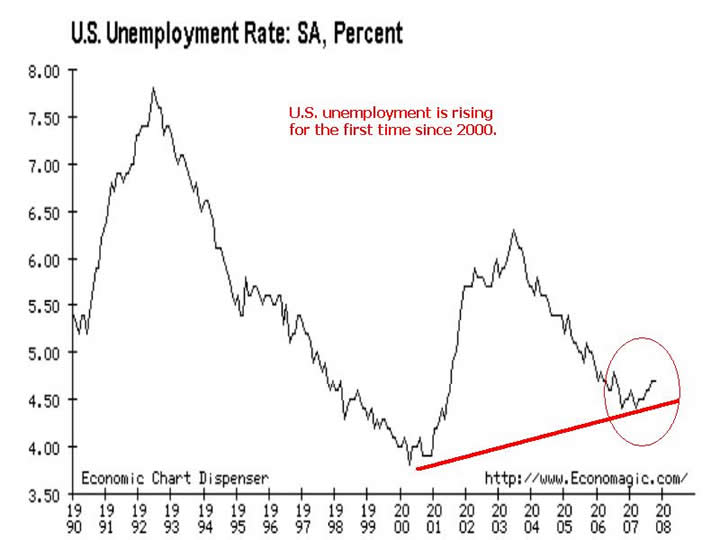
Unemployment figures (Chart 2) are also a key indicator on the health of the economy. Historical records show that 6.50% or higher are often the bottom of the stock market and levels of 4.50% or lower are close to the top. With current levels of 4.75% and climbing, the data suggests the growth in the U.S. economy is starting to shrink in 2007 and unemployment is on the rise again.

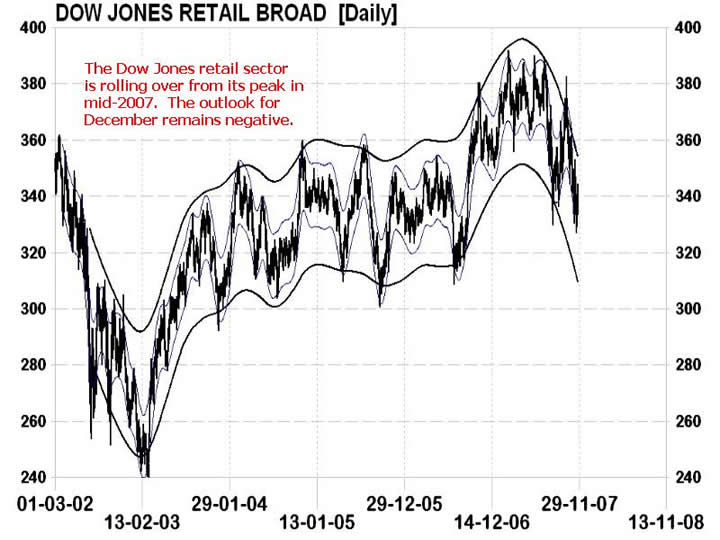
The retail sector is another gauge that measures consumer optimism. Growth or weakness in this area indicates the consumers attitude towards the economy. The Dow Jones Retail Index (Chart 3) peaked in mid-2007 and has been steadily falling for six months.
Bottom line: Evidence is slowly building which points to a weaker U.S. economy for 2008. The implications of these three charts suggest the outlook for the present bull market in 2008 is turning less optimistic.
Investment approach: Weakness in the U.S. economy will result in lower Fed rates starting with the December 11 meeting. As the rates are cut, the U.S. dollar will fall even further. The results will drive gold prices higher and keep oil and most commodities advancing. Lower interest rates are also positive for interest sensitive stocks like utilities and bullish for bonds.
More economic information and stock and commodity market analysis can be found in the upcoming December newsletter. This will be available on line December 1st.
Your comments are always welcomed.
By Donald W. Dony, FCSI, MFTA
www.technicalspeculator.com
COPYRIGHT © 2007 Donald W. Dony
Donald W. Dony, FCSI, MFTA has been in the investment profession for over 20 years, first as a stock broker in the mid 1980's and then as the principal of D. W. Dony and Associates Inc., a financial consulting firm to present. He is the editor and publisher of the Technical Speculator, a monthly international investment newsletter, which specializes in major world equity markets, currencies, bonds and interest rates as well as the precious metals markets.
Donald is also an instructor for the Canadian Securities Institute (CSI). He is often called upon to design technical analysis training programs and to provide teaching to industry professionals on technical analysis at many of Canada's leading brokerage firms. He is a respected specialist in the area of intermarket and cycle analysis and a frequent speaker at investment conferences.
Mr. Dony is a member of the Canadian Society of Technical Analysts (CSTA) and the International Federation of Technical Analysts (IFTA).
Donald W. Dony Archive |
© 2005-2022 http://www.MarketOracle.co.uk - The Market Oracle is a FREE Daily Financial Markets Analysis & Forecasting online publication.


