How the Stock Market Prices In Recession
Stock-Markets / Stock Markets 2011 Jun 30, 2011 - 02:25 AM GMTBy: Tony_Pallotta
 I'm not going to even begin to try and make sense out of today's market. Watching fires burn and teargas fired in Greece, 100 pip moves in the EUR/USD in minutes and computer algos tripping over each other was surreal beyond words. This market right now is a lottery. Calling equities forward looking or a pricing mechanism is beyond ridiculous.
It is during noisy times like these that investors must step back and keep things in perspective. Trading on days like today requires little skill and a lot of luck. When I step back I see a deteriorating economy and an equity market trying to understand what to do. Do they "price in" a soft patch or a full blow recession. Market participants are told it is in fact a soft patch. The slightest hint of positive data reinforces those views.
Using history as an example I want to share with you the 2007 "soft patch" and how equity markets priced in that economic headwind as well.
Below are a few notable quotes discussing the soft patch which in fact was a recession that began in December 2007 with Q1 2008 the first full quarter of contraction at minus 0.7% from the plus 2.9% in Q4 2007 (my how fast things can change).
"We anticipate a soft patch in the middle of next year." - Morgan Stanley December 6, 2007
"The economy is in a soft patch right now" - Mike Moran of Daiwa Securities December 23, 2007
"Meanwhile, the Goldilocks economy remains alive and well." - Larry Kudlow January 4, 2008
"The Federal Reserve is not currently forecasting a recession. It is however forecasting slow growth" - Fed Chairman Bernanke January 10, 2008
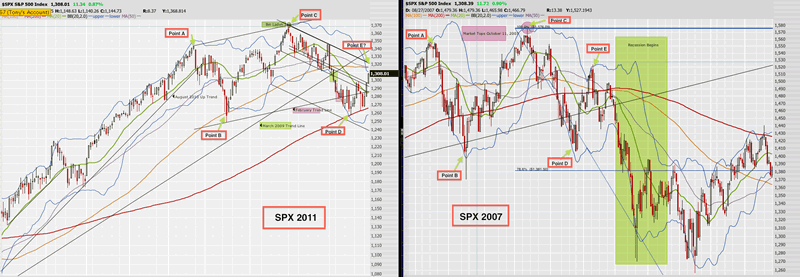
The following side by side comparison of the current SPX and that of December 2007 is messy but "bear" with me as the similarities are rather interesting. This is not an Elliott Wave analysis either. Notice the relationship among Point A, B, C, D and E on both charts.

The two highs of the topping pattern are Point A and C with C being slightly above A (imagine those technicians declaring a breakout).
The two lows of the corrections are Point B and D with D being slightly above B (imagine those technicians saying we put in a higher low thus bullish for price).
Point E is the question in terms of where we are now. Using the current trend lines off the 1,370 high SPX 1,320 would be the modern day Point E.
Equity markets struggled in 2007 to price in the recession efficiently and were only two months forward looking. In this highly leveraged, exuberant and low cash market why are we to think 2011 is any different?
As a reminder of a few other similarities, here you go.
We have leverage back at pre Lehman Brother levels
We have record low cash levels at mutual funds
We have the end of QE2
We have forecasts for contraction in Friday's ISM manufacturing based on actual regional manufacturing data for June
By Tony Pallotta
Bio: A Boston native, I now live in Denver, Colorado with my wife and two little girls. I trade for a living and primarily focus on options. I love selling theta and vega and taking the other side of a trade. I have a solid technical analysis background but much prefer the macro trade. Being able to combine both skills and an understanding of my "emotional capital" has helped me in my career.
© 2011 Copyright Tony Pallotta - Disclaimer: The above is a matter of opinion provided for general information purposes only and is not intended as investment advice. Information and analysis above are derived from sources and utilising methods believed to be reliable, but we cannot accept responsibility for any losses you may incur as a result of this analysis. Individuals should consult with their personal financial advisors.
© 2005-2022 http://www.MarketOracle.co.uk - The Market Oracle is a FREE Daily Financial Markets Analysis & Forecasting online publication.


