The Macro Economic Picture And The Outlook For Stocks
Stock-Markets / Stock Markets 2011 Jun 27, 2011 - 08:12 AM GMTBy: John_Hampson
 Increasing numbers of writers are bearish on the outlook for the markets and the likelihood of recession. Take a look at the deteriorating picture:
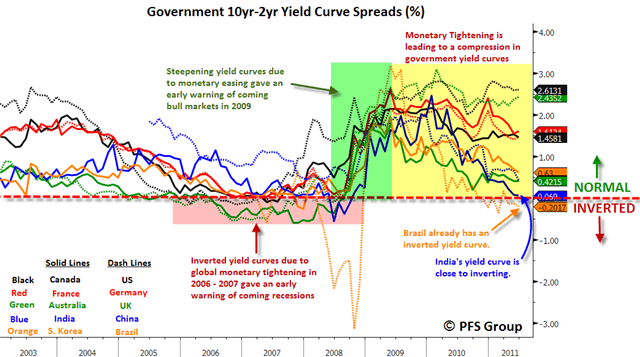
1. The Yield Curve is inverted in Brazil and close in India. Other countries are trending towards that situation, and an inverted yield curve has historically led to bear markets.
Source: PFS Group
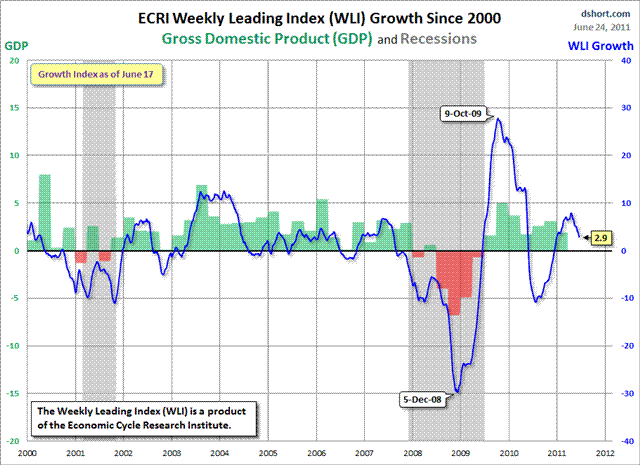
2. Global leading indicators have weakened. ECRI's WLI for the US is trending down towards the key zero level.
Source: Dshort/ECRI
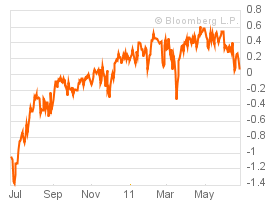
3. The Bloomberg Financial Conditions Index is edging towards negative again.
Source: Bloomberg
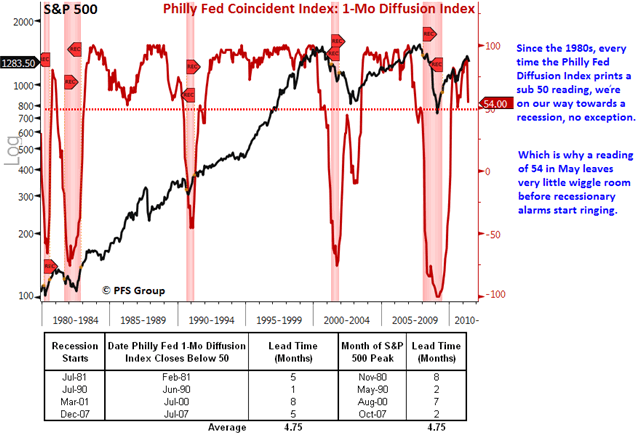
4. The Philly Fed Coincident Index is weakening towards the key 50 level.
Source: PFS Group
5. Greece is voting on its austerity package this week and it is likely to be close. A rejection would increase the likelihood of a Greek default with subsequent knock-on effects.
We can conclude that an improvement in the economic picture is required fairly soon, otherwise pro-risk assets are going to struggle. And at this fragile time, the support of QE is about to be withdrawn.
Turning to the market action, the situation is similar. The US dollar is threatening to breakout, various commodities and stock indices have broken key levels, and the S&P500 is flirting with its 200MA support.
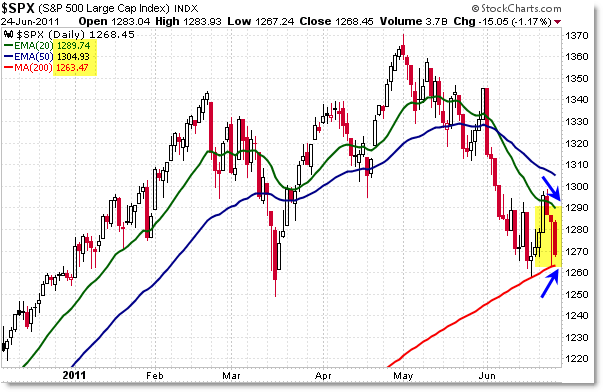
Source: Afraid To Trade
Again, reversals are required fairly promptly for the whole set not to break down technically.
But.... despite all the above, I maintain this is a BUY opportunity. In fact, historically, this kind of confluence of terrible news and fragile price action has been a contrarian inflection point - such as last summer - so long as other indicators point to cyclical bull continuation.
Well, the Citigroup Economic Surprise Index is at a level usually associated with forthcoming improvement. A recovering Japan and a declining oil price supports that likelihood. Recession models suggest slim chance of a new recession. The Bull Market Sustainability Index and lack of breadth divergence at the April/May top support cyclical bull continuation. All the leading indicators above (yield curve, ECRI, stock market, etc) are NOT yet flashing danger - generally speaking, the trends are negative but the readings still positive. Growth forecasts are still for an upturn in H2 2011. A reversal in such data is more likely than a slide into negative feedback looping.
But regardless of whether the economic picture improves in due course, the next big move is still likely to be a rally.
I refer you to my articles of last week demonstrating that this is a market stretched to the downside, like an elastic band, ready to bounce back. Indicators are still at historic buy levels.

Source: Short Side Of Long
Stock market volume increased the last 2 days of last week suggesting a move up is coming. Asian indices have broken back upwards in the last several sessions. Geomagnetism is forecast to be low for the next 3 weeks and we are heading into the new moon in early July, which should provide upward pressure.
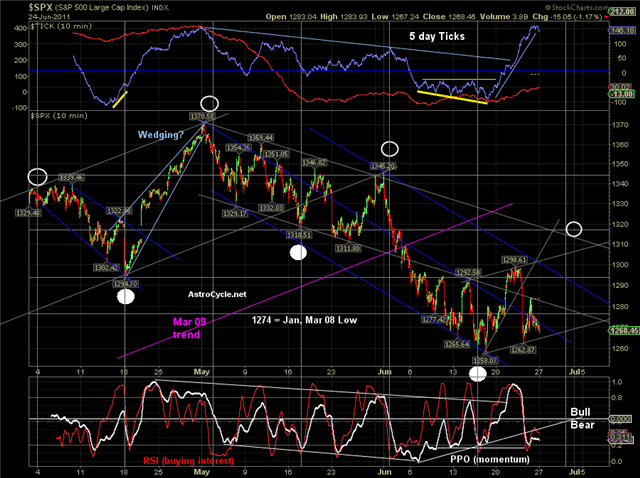
Source: Astrocycle
We have seen a spike in the Vix and have a positive divergence on the Nymo. In short, ample measures and indicators giving readings that have historically reliably called a rally.
John Hampson
John Hampson, UK / Self-taught full-time trading at the global macro level / Future Studies
www.amalgamator.co.uk / Forecasting By Amalgamation.
© 2011 Copyright John Hampson - All Rights Reserved
Disclaimer: The above is a matter of opinion provided for general information purposes only and is not intended as investment advice. Information and analysis above are derived from sources and utilising methods believed to be reliable, but we cannot accept responsibility for any losses you may incur as a result of this analysis. Individuals should consult with their personal financial advisors.
© 2005-2022 http://www.MarketOracle.co.uk - The Market Oracle is a FREE Daily Financial Markets Analysis & Forecasting online publication.


