


Stock Market Plunge Protection Team Losing Traction?
Stock-Markets / Stock Markets 2011 Jun 24, 2011 - 07:11 AM GMTBy: Brian_Bloom

 To this analyst, analysing charts of the markets is like doing a jigsaw puzzle. With patience, when you put the pieces together – and they fit comfortably – a picture begins to emerge. Often, the outline of the picture becomes visible well before the media reports on it. To those who enjoy the adrenalin rush of making trading profits (and losses) the revelation of the long term picture is not relevant. “Look at all the action we missed because the big picture told us to stay out!” Well, the article below might go some way towards explaining why the big picture is highly relevant – even to those with a trading mentality.
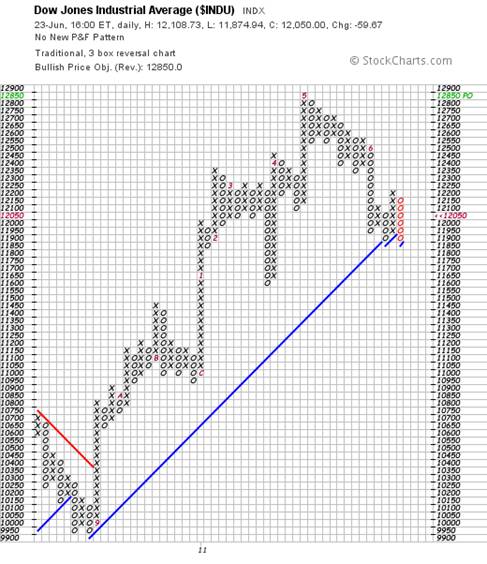
The last three columns in the Point and Figure chart below, of the Dow Jones Industrial Index, seem to me to be pointing to the possibility that the plunge protection team has been trying – and failing – to keep the US equity market from falling. Technically, if the Dow Jones falls to 11,850 or below, then we will see what is known as a descending double bottom breakdown. Such a development will be technically very bearish because the next stop will be 11,600 and the one after that will be 11,000. To argue that the Dow Jones “recovered” in the closing hours of trading today because Greece has agreed to go on a starvation diet seems whimsical to me given that the US Fed Chairman had earlier in the day expressed confusion as to why the US economy is not recovering as the authorities expected.
(Point and Figure Charts courtesy of stockcharts.com)
It needs to be taken into account that the above chart has a sensitive scale and is oriented towards traders.
When we eliminate the sensitivity by choosing a 3% X 3 box reversal chart (no zeros will be reflected in the column immediately to the right until the price has retraced 9%) we see an ominous sign:
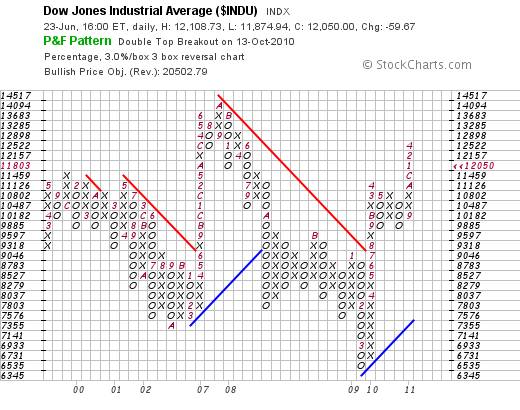
The most recent perpendicular column of rising x’s can be described as a “high pole”. Typically, in a bull move, any price retracement from the peak of the pole will be confined to a maximum of 50% of the height of the pole. If the price retraces more than 50% of the move then the probabilities are that it will retrace all of the move.
Why is this relevant? It is relevant because a fall to 11,000 on the first chart will take the Dow past the 50% level on the second chart. The next stop after that will be 9,885. And if that level is penetrated on the downside then the Dow might find itself in free fall. Note that there is no technical evidence at present that it will break below 9,885. All we can say is that the risks are rising.
So, if the Plunge Protection Team fails to prevent a bear market from emerging, what weapons are left to them?
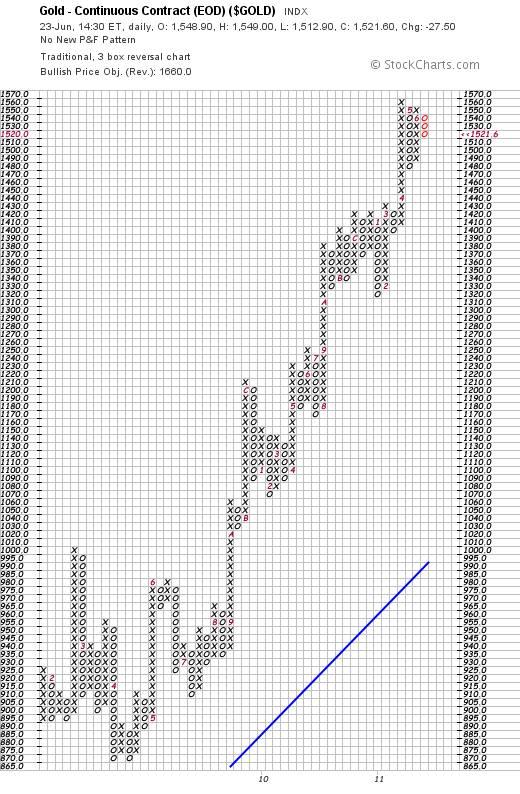
A little over a week ago I wrote an article which suggested that the charts were pointing to a possible bear raid on gold by the financial authorities. (http://www.marketoracle.co.uk/Article28695.html ) In it, I argued that if the markets were to start heading south, then the most logical thing for the Fed to attempt to do would be to ensure that the decline was orderly as opposed to driven by panic. Because a rising gold price would accompany panic, it would need to be held back. For a while there it looked like I had misread the chart messages as the gold price continued to rise. But, today, something strange happened. The gold price fell by $27.50. (It’s probably important for me to re-iterate at this point that I am long term bullish on gold from a fundamental perspective. My comments in that article (and this) were/are confined to technical market behaviour)
What are the technical implications of this $27.50 fall?
Firstly, the fall brought the descending column of o’s back to the 50% level of the height of the column of x’s that preceded it. Looking ahead, if the price falls to $1,510 then it will likely fall back to $1,480. If, thereafter, it falls to $1470 or below then we can expect the gold price to continue falling until it reaches support at around $1,430
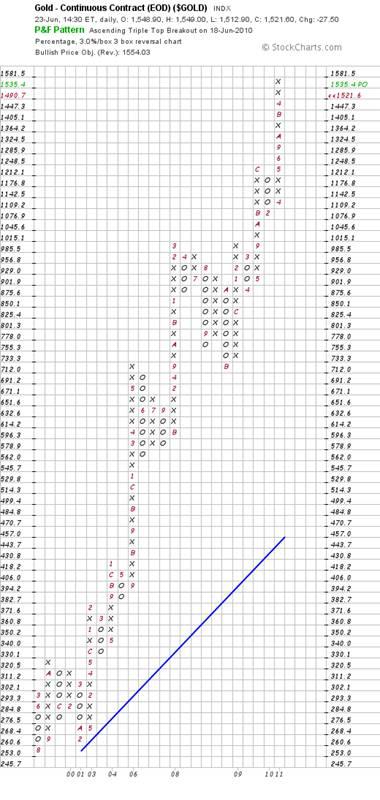
According to the less sensitive chart below, $1430 will still be “safe” because no column of three zeros will be reflected until we hit $1405. Thereafter it’s anyone’s guess. My “guess” is that the gold price might fall to as low as $1,000 and still be in a strong bull trend.
But while we are looking at the concept of managing markets, another supposed reason that the equity markets recovered towards the end of the day’s trading today – and that the gold price fell – was that the oil price fell. So let’s have a look at the chart of the oil price.
Hmm?? A High Pole reversal warning was given on June 21st. Technically, if the oil price falls to $89.92 or below, the 50% mark will have been violated and the price could fall all the way back to at least $84
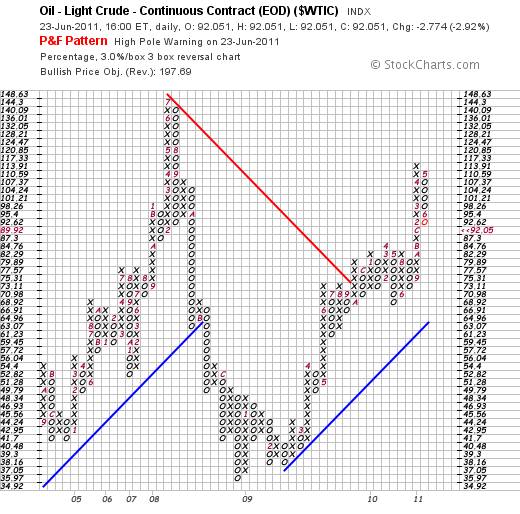
But bearing the jigsaw puzzle analogy in mind, the reader should focus on the high probability that, if the falls in the gold and oil prices were “engineered”, then the management of the markets goes beyond the United States Federal Reserve’s Plunge Protection Team. Management of gold and oil prices will point to the probability that such action is co-ordinated amongst a group of nations – and probably including China.
Why including China?
Because China is supposed to be a buyer of gold – and it is most certainly developing a more voracious appetite for oil as its motor car factories churn out new vehicles for purchase by its citizens. Falling gold and oil prices cannot be engineered without China’s compliance. ‘But’, you argue, ‘this can’t be true. “Everyone” knows that because China is a net buyer of gold there is a floor under the gold price.’ Well, dear reader, as they might say in the US: What everyone knows is not worth a plugged nickel. (Gold philes might benefit from looking up the origin of that phrase J)
So the evidence suggests that the markets are now emerging as battle grounds between speculators (who are flush with cash) and the authorities (who presented them with that cash and are now trying to manage how that cash is applied).
Does anyone else see the ridiculousness of this? Whatever happened to fundamentals? Yes, traders can capitalise on this state of affairs and aspire to make profits from trading in the short to medium term, but it’s rather like a wood framed house being eaten by termites. The house looks perfectly fine until it collapses in a heap. All you’re left with thereafter is sawdust and termites.
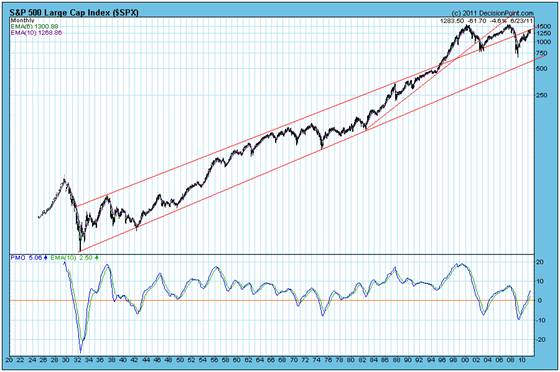
The multi decade chart of the SPX below (courtesy DecisionPoint.com) gives some idea of where this might all end up. The SPX might fall from around 1,280 to around 750 (by 40%) – provided the lower level trend line is not penetrated on the downside, which might well happen if the termites prevail.
So let’s look at the fundamentals
Fundamentally, humanity is facing a new kind of challenge. Population growth has resulted in consumption of so much fossil fuel that the environment is starting to fight back. This has never happened before.
The chart below was published in The New Scientist Magazine in May 1985
What it shows is that the emergence of new energy paradigms is a natural phenomenon – driven by biological forces. If the oil and coal lobbies had not blocked the emergence of new energy paradigms in 1998 (by engineering a failure on the part of the US and Australia to ratify the Kyoto protocols) then we would probably be ten years down the track of transferring our primary reliance for energy from oil to natural gas. In the event, our reliance on coal spiked and carbon dioxide emissions escalated.
Now, although there is an argument raging between the industrially oriented population who prefer to believe that our climate is driven by cosmological forces and the environmentalists who prefer to believe that anthropogenic greenhouse gases have been causing global warming, two facts are unarguable:
- The planet is experiencing climate change
- If we wait until the cause of climate change becomes “certain” then it will be too late to do anything about it.
We need to act! And the most logical course of action will be to recognise that whether we are headed for generally warmer climate or whether we are headed for an ice age, energy demand will spike. And even if the climate is just experiencing a hiccup, demand for energy will spike because world population is expected to grow by 30% in the next 40 odd years. In this context, if we continue to rely on fossil fuels, and the CO2 argument is correct, then we might be hurtling towards a brick wall at an accelerating pace. And even if the “CO2 causes global warming” argument turns out to be incorrect, the link between fossil fuels and environmental pollution is unarguable.
Why accelerating?
Quote:
“ICF Consulting, a Virginia-based energy and environmental consulting firm, projects that unconventional natural gas extraction methods, including fracking, will increase from 42 percent of U.S. gas production in 2007 to 64 percent in 2020. “
Read more: Hydraulic Fracturing - Fracking Natural Gas - Popular Mechanics
What the average person in the street does not (yet) understand is that fracked gas is methane (CH4) and methane is up to twenty times more virulent a greenhouse gas than CO2. Yes, CO2 emissions “may” fall slightly when fracked gas is burned instead of coal and oil. But if pure methane is released into the environment it will only need to happen 5% of the time (1/20) to negate the savings in CO2 emissions.
Interim Conclusion
Continued reliance on fossil fuels may be industrially/economically sensible but, from an environmental perspective, it will be like multiplying the termite population in our wood structured house when we should be reducing the termite population. To be blunt: By allowing a continuing reliance on fossil fuels, society’s leaders are in the process of gutting us (and themselves).
A “pyrrhic victory” is a victory which is won at a devastating cost to the victor. Hopefully, I have managed to convince the reader by means of the above that the authorities – world wide – have set a course which is likely to result in a pyrrhic victory even if they succeed in managing the markets. The argument that is raging regarding whether the world should be on a fiat currency system or a gold currency system is nothing other than a diversion at present. The problem is “energy”. The question that the authorities should be asking is “how can we organise our affairs so that global energy output per capita is maintained – without impacting on our environment to the extent that humanity is wiped out in the process?”
The reason that we want global energy output per capita to be maintained is that “energy” is what drives the world economy – NOT money supply. Have another look at the chart reproduced from the New Scientist Magazine. Note that the market penetration of oil as the primary source of energy was modelled to peak in around 1975 – 1980.
Now have a look at the chart below – courtesy Dr Richard Duncan, originator of The Olduvai Theory – and try to ignore the chart on a go forward basis. I am trying to focus on unassailable historical facts for the moment.
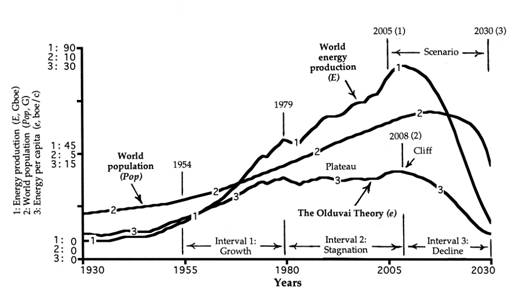
This chart reflects global energy output in “Barrels of Oil Equivalent”. Note how line #3 (energy per capita) peaked in 1979 – exactly in line with the topping out of market penetration of oil.
Now have a look at the multi decade chart of the $SPX above and focus on the year 1974. Note how the $SPX was testing support of the lower trend line. It was during the period 1975-1980 that a decision was taken by the authorities to switch the USA from a net forex earner to a net forex spender. The US remained the undisputed engine of the world’s economy – by switching from a seller to a buyer; with its deficits financed by credit.
Note also how energy output per capita hit a (technical) “double top” in 2008 – the year in which the Global Financial Crisis manifested.
Coincidences? Well, if you believe in fairies then, yes, all of this was just pure coincidence. Is there still anyone out there who is predisposed to argue against the picture that is emerging from this particular jigsaw puzzle?
From a global (society) perspective, dear reader, “wealth” is not created by piling up mountains of cash of increasingly dubious value. Wealth is created by adding value to resources and by piling up mountains of value. From 1980 onwards, because energy per capita has been flat, wealth has been transferring from the Industrialised countries to the Industrialising countries. That is WHY debt levels in the west have been rising. And, if global energy output per capital is to fall for any reason, then wealth will begin to be destroyed on a global basis. Civilisation will go into decline across the planet – just as Richard Duncan’s chart is forecasting.
Which presents us with a very thorny dilemma: On the one hand, if we embrace alternative energies that are less powerful than fossil fuels, accumulated wealth will begin to erode. On the other hand, if we are going to continue relying on fossil fuels and this will result in a pyrrhic victory.
So, what alternatives are there?
Cutting through the emotional crap, in the absence of energy storage technologies, neither wind nor solar can be relied on for baseline energy. In any event, if climate change is really manifesting then forecasts regarding available energy from solar and wind – based on historical numbers – will not be reliable indicators. Solar will become less reliable if global cooling arrives and wind will become less reliable if global warming continues.
But here is a clue. The energy contained in one kilogram of various materials is as follows:
- Coal: 35,000 kilojoules1
- Gasoline: 48,000 kilojoules2
- Natural Gas: 43,000 kilojoules3
- Uranium (U-235): 74,000,000,000 kilojoules4
Sources: 1 http://en.wikipedia.org/wiki/Coal
2 http://www.convertunits.com/from/kilojoules/to/gallon+%5BU.S.%5D+of+automotive+gasoline
3 http://www.engineeringtoolbox.com/fuels-higher-calorific-values-d_169.html
4 http://www.evworld.com/library/energy_numbers.pdf
Conclusion
With “energy from the atom” being over 1.5 million times as powerful as that sourced from fossil fuels, the most sensible (logical) place to look for new energy paradigms is “inside the atom”. However, as a caveat, when something is 1.5 million times as powerful it is also, arguably, 1.5 million times as dangerous.
Author Comment
The article in The New Scientist magazine dated May 2nd 1985 (entitled “Swings, Cycles and the Global Economy”) – from which the relevant chart above was reproduced – proved beyond a shadow of doubt the truth of the cause-and-effect linkage that the economist Schumpeter had been arguing regarding technological developments and economic activity. Further, if technology is driven by energy and energy emerges as a consequence of a natural heartbeat then this would explain why Nikolai Kodrat’eff’s long (55-60 year) economic wave emerges. It would also explain why any attempt by the world’s financial authorities to “manage” the economic long wave can become seriously counterproductive. Any attempt to prevent a heart from beating naturally will result either in death or serious incapacitation. And, again taking a leaf out of nature’s book, the heart of a physically fit person beats slower than that of an unfit person. The last thing you want to do is speed up the heartbeat of an unfit person.
When I came to understand this – in 1985 – I began to apply my mind to possible alternative methods of “managing” the economy. The conclusion to which I eventually arrived was that, if energy is what drives the world economy, and energy from the atom was where we should be looking, then what we should really be doing is looking at ways of either avoiding, or managing or finessing the risks of accessing energy from the atom.
Logically, there are three ways to access this energy:
- By splitting (fissioning) the nucleus of the atom and harvesting a tiny proportion of the vast amount of energy that is released in the process
- By joining (fusing) two atoms and harvesting a small proportion of the energy that is given off as a by-product when a disparate element is created.
- By “finessing” the nuclear Strong Force that binds the nucleus of the atom and harvesting a large proportion of the much smaller amount of energy that is released in this far more gentle manner.
3 above is regarded as impossible by mainstream physicists who argue that such a concept would, in addition to defying logic, cut across at least one and possibly two of the “immutable” laws of thermodynamics. I happen to disagree with this argument as a matter of philosophical principle. In the 1930s these same mainstream physicists argued that the strong force could not possibly be overcome and that, therefore, it was impossible to split the nucleus of the atom. Well, they were unarguably wrong. And I believe that the reason they will eventually be proven wrong on this “call” is that by their own admission they do not fully understand the energy that pervades the universe – of which around 90% is undetectable or “dark”.
2 above is regarded as highly improbable in terms of its technical achievability. I happen to agree.
My novel, Beyond Neanderthal, presents one possible avenue of investigation to finesse the Strong Force – and also a possible avenue of investigation for a potentially revolutionary technology for storing “unlimited” amounts of energy. In my view, both of these avenues are worthy of disciplined investigation notwithstanding scientific prejudice.
However, looking back, it now seems to me that this book might be at least one generation ahead of its time. For that reason I wrote The Last Finesse, which examines nuclear fission from various angles and pays particular attention to distinguishing myth from fact. The Last Finesse also takes an in-depth look at Climate Change and separates myth from fact there too. It also looks as one possible way in which the US Public Debt might be legitimately repaid – as opposed to written off or inflated away. It also looks at one possible way of embracing nuclear fission technology in a way that facilitates management of the associated risks far more tightly than heretofore. That the current methods of management are failing is clearly evident from both Fukushima and from the recently published Associated Press article regarding the state of the US nuclear industry. (see: http://news.yahoo.com/s/ap/20110620/ap_on_re_us/us_aging_nukes_part1 )
Like Beyond Neanderthal, The Last Finesse is a factional novel that is written in simple English. Both convey serious facts in an entertaining manner. The manuscript of The Last Finesse is currently being professionally edited and I am targeting to make it available via Amazon and other retailers from September 2011, in e-book format, at a peppercorn price.
Beyond Neanderthal will also be available in this format towards the end of July and can be ordered in hard copy from Amazon right now. People interested in acquiring a copy of The Last Finesse should please email me at info@beyondneanderthal.com and I will record their details on a (confidential) database and contact them when the book/s are available.
By Brian Bloom
Once in a while a book comes along that ‘nails’ the issues of our times. Brian Bloom has demonstrated an uncanny ability to predict world events, sometimes even before they are on the media radar. First he predicted the world financial crisis and its timing, then the increasing controversies regarding the causes of climate change. Next will be a dawning understanding that humanity must embrace radically new thought paradigms with regard to energy, or face extinction.
Via the medium of its lighthearted and entertaining storyline, Beyond Neanderthal highlights the common links between Christianity, Judaism, Islam, Hinduism and Taoism and draws attention to an alternative energy source known to the Ancients. How was this common knowledge lost? Have ego and testosterone befuddled our thought processes? The Muslim population is now approaching 1.6 billion across the planet. The clash of civilizations between Judeo-Christians and Muslims is heightening. Is there a peaceful way to diffuse this situation or will ego and testosterone get in the way of that too? Beyond Neanderthal makes the case for a possible way forward on both the energy and the clash of civilizations fronts.
Copies of Beyond Neanderthal may be ordered via www.beyondneanderthal.com or from Amazon
Copyright © 2011 Brian Bloom - All Rights Reserved
Disclaimer: The above is a matter of opinion provided for general information purposes only and is not intended as investment advice. Information and analysis above are derived from sources and utilising methods believed to be reliable, but we cannot accept responsibility for any losses you may incur as a result of this analysis. Individuals should consult with their personal financial advisors.
Brian Bloom Archive |
© 2005-2022 http://www.MarketOracle.co.uk - The Market Oracle is a FREE Daily Financial Markets Analysis & Forecasting online publication.