


Platinum to Gold Ratio and Detecting Bubbles
Commodities / Gold and Silver 2011 Jun 22, 2011 - 02:31 PM GMTBy: Willem_Weytjens

An article on BespokeInvest about the Platinum-to-Gold ratio today drew my attention.
I therefore wanted to get to know more about this ratio. I knew that the ratio had been trading around 2 over the last 10 years, which was why I invested heavily in Platinum and its little sister metal Palladium in December 2008 and early 2009 when prices crashed, and Platinum became cheaper than gold (the ratio thus dropped below 1). When the economy rebounded, the ratio rebounded to 1.50, but the last couple of months, it has been declining again, and is approaching 1 again, as it is currently at 1.13 with gold prices around 1546 and Platinum around 1742.
I thus started to dig deeper and found historical data at kitco.com
I created an excel sheet with monthly average prices since 1968 which is available for download HERE .
Below you can see some interesting charts that resulted of some calculations in the Excel sheet.
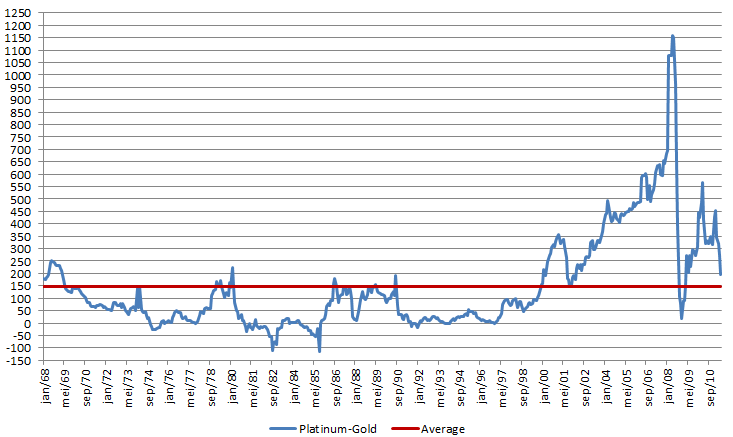
The first chart is the nominal absolute price difference between one ounce of Platinum and one ounce of Gold.
We can see that the difference was skyhigh early 2008, and then crashed. It went even negative for a couple of days (not shown in the chart, as this chart shows monthly averages), meaning that at some point gold was more expensive than Platinum:
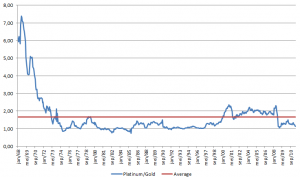
The second chart shows the Platinum-to-Gold ratio since 1968, and shows how many ounces of gold you can buy with one ounce of Platinum. From this perspective, it looks like the Platinum-to-Gold is very low at the moment, just like the article at BespokeInvest stated. However, this chart might be misleading, as the huge spike in 1968 takes away all the attention.
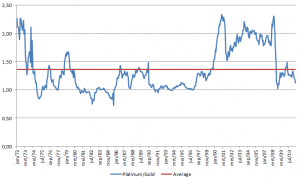
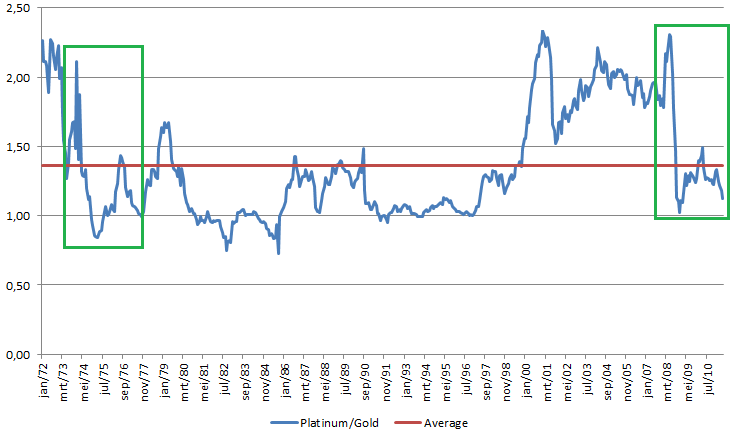
I therefore removed the data until 1971 in the following chart, which gives us a clearer image of the period from 1972 until today:
As we can see, the ratio was as low as 0.75 in 1982 and as low as 0.73 in 1985 (see the excel sheet for more detailed information).
The average ratio between 1972 and 2011 was 1.36. We can also see that the ratio found “support” at 1.00 a couple of times.
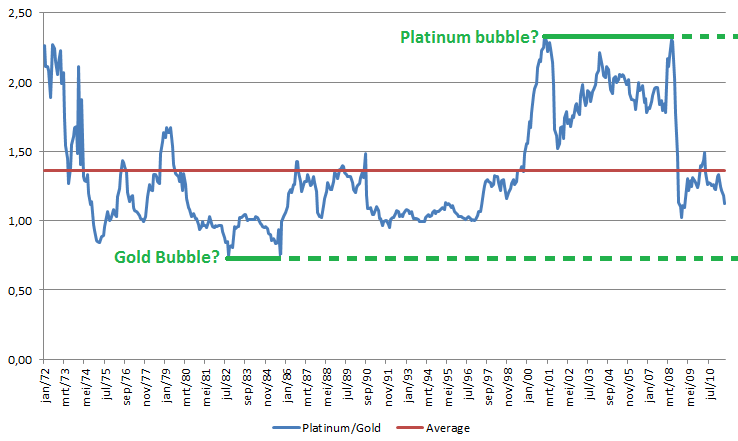
Can we detect bubbles using these charts? Maybe. Let's check it out.
The Platinum-to-Gold ratio topped twice around 2.35: once at 2.34 in January 2001 and once at 2.31 in May 2008.
At both times, a major economic crisis followed, causing the ratio to drop sharply.
The ratio bottomed at 0.75 in September 1982, after the Gold bubble had popped a year earlier. So who knows, maybe this ratio might help us next time spotting a bubble?
Where are we now? Hard to say, although a ratio of 1 has provided support in the past.
If we use some imagination, we can see similarities between the early '70s and today:
For people who want more information about why people invest in Platinum, I think this article from CPMgroup from 1995 might be an interesting read.
Willem Weytjens
www.profitimes.com
© 2011 Copyright Willem Weytjens - All Rights Reserved
Disclaimer: The above is a matter of opinion provided for general information purposes only and is not intended as investment advice. Information and analysis above are derived from sources and utilising methods believed to be reliable, but we cannot accept responsibility for any losses you may incur as a result of this analysis. Individuals should consult with their personal financial advisors.
© 2005-2022 http://www.MarketOracle.co.uk - The Market Oracle is a FREE Daily Financial Markets Analysis & Forecasting online publication.