


Stock Market S&P500 Index and Decreased Solar Sunspot Output
Stock-Markets / Stock Markets 2011 Jun 20, 2011 - 09:35 AM GMTBy: David_Petch

 There were a series of articles put out this past week on sunspots: drop in sunspots, solar minimums and STEREO of sun all came out earlier this week. The take home message is "this could be the last solar maximum we'll see for a few decades. That would affect everything from space exploration to Earth's climate."
There has been chain of severe climate events the past 5 years, with rare weather occurrences in certain locations all of a sudden, causing flooding, famine or heat waves. One side effect of global warming is the melting of huge glaciers. Greenland for example has so much ice on its surface that it is pushing the Earth's crust down 1 km. Once this ice melts, there will be an equal and opposite reaction, which in turn will cause the built up pressure to be released somewhere. All of these subtle things are linked together in one way or another.
The important note is that the Sun's cycle is 11 years and sunspot minimums could last for this at a minimum. The mini ice age from 1645-1715 was such a period when no sunspots were observed. Colder weather was observed globally, which put pressure on food supplies. As alluded to earlier this week, colder weather requires more energy to heat homes etc. which is going to strain natural gas prices at some point in the future. Individuals should try to have a 6-12 month supply of dried food, because shortages cause prices to rise.
People function out of necessity when it comes down to survival, so survival stocks of the future will be related to energy,agriculture and precious metals. I tried to pull together other articles relating to the sun, but these three capture the heart of the matter.
To make matters worse, the nuclear disaster is causing some nations to say no to newly designed reactors with Uranium in graphite balls (bed reactors) that have no chance of every reaching a critical melting stage and are extremely safe. Wind and solar will not cut it for Germany. To follow through with their new energy policy puts them at their electrical grid and economy into the hands of Mother Nature or worse, the Middle East and Russia. If it is the latter two, they will have to be on their best behaviour. The new wars of the future will be more economic and cyberspace than traditional.
Onto the markets, there will be no kind of financial apocalypse happening until late 2012/early 2013. With silver inventories at record lows within the COMEX and the USD set to rise for another 5-7 months, the stage is being set for an explosive 2012. Three year bonds in Greece were at 28.6% yesterday, while 10 year bonds were 17.change%. The US financial system is in more of a predicament than Greece and at some point when it hits home, this effect will be more of a ripple in the pool than Greece. Interest rates have no where to go but up, so make sure any larger item that is required is bought sooner rather than later, or start saving because no one wants to pay 10% interest on a car.
Rising interest rates will slow and change the economy from a "Buy now, pay later" mentality to "Buy as you need it". Expanded credit automatically causes growth, whereas higher interest rates slow this phenomenon...kind of like a jogger trying to run a 4 minute mile with 10 pounds of lead in each shoe. As long as interest rates rise and currencies remain weak against tangibles, this will keep the stock market afloat and send it to new highs. Once interest rates peak and markets settle to higher lows, everyone will be broke and the long-term 70 year economic cycle can start again. I do want to stress however that unprepared individuals will be burned for life on that mistake.
S&P 50 Index
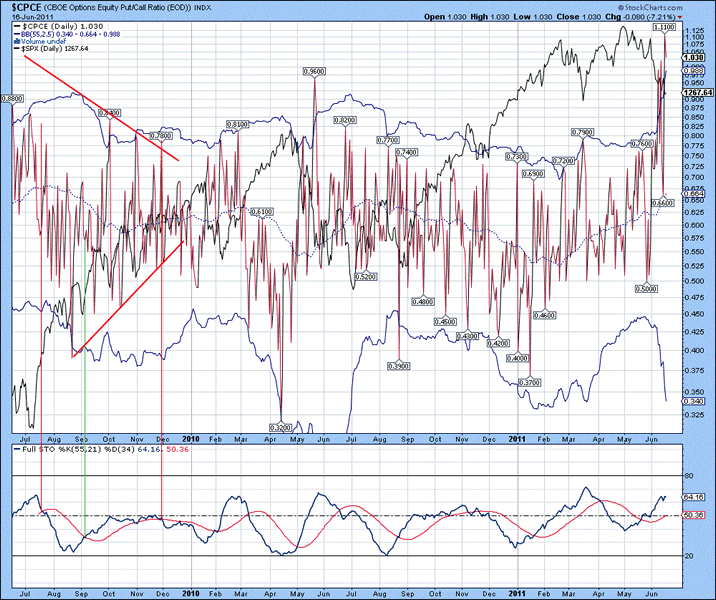
The daily chart of the CBOE Options equity put call ratio index shown below, with it recently touching 1.10...an extremely oversold level, strongly suggestive that a bottom is in the process of forming. The upper Bollinger band was pierced, providing further evidence of a looming bottom. For this chart and this chart only, the %K above the %D is a sign of general weakness in the broad stock market indices, while a move beneath is a sign of strength. At present, the %K is above the %D, suggestive that further time is likely required before a bottom is put in place.
Figure 1
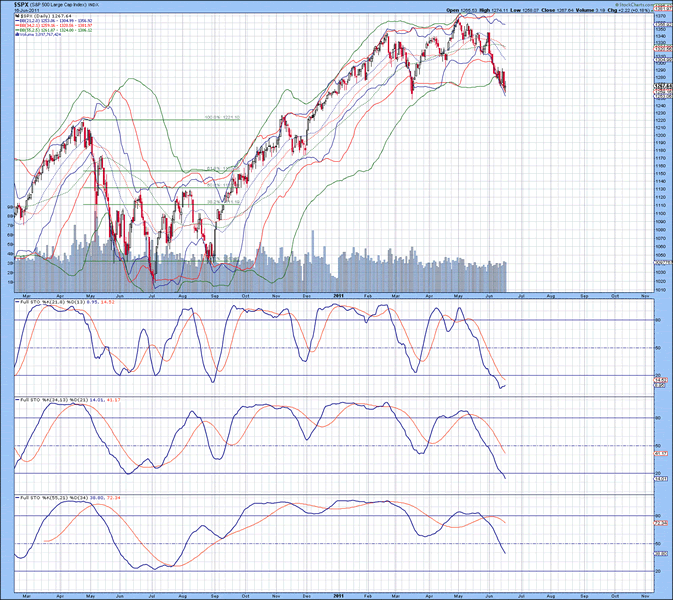
The daily chart of the S&P 500 index is shown below, with lower Bollinger bands still following the index lower. Pausing around the current price levels for another 3-5 days will cause the lower Bollinger bands to continue declining, which would indicate that a bottom was nearing completion. Full stochastics 1, 2 and 3 are shown below in order of descent, with the %K beneath the %D in all three instances. Positioning of the %K in stochastic 2 and 3 suggest that another 7-10 trading days could be required before the ups and downs of the market settle to allow a partial retrace of the recent decline.
Figure 2
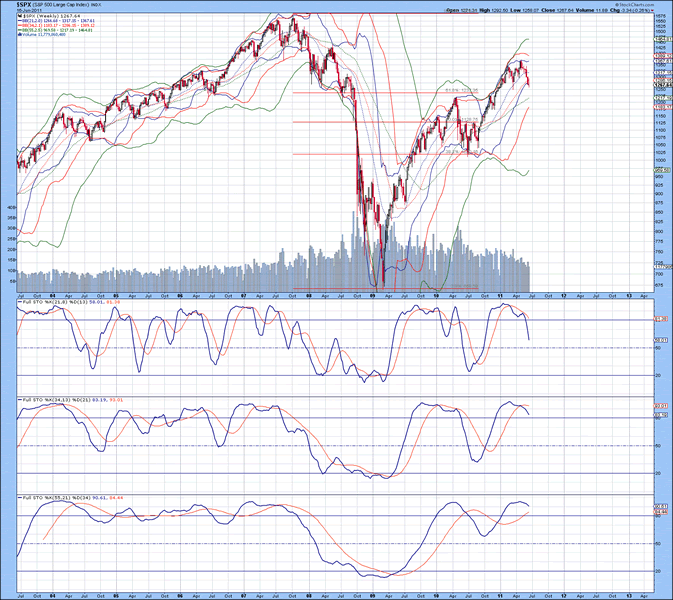
The weekly chart of the S&P 500 index is shown below, with the lower 55 MA Bollinger band curling up, further confirming that a top was put in place. Full stochastics 1, 2 and 3 are shown below in order of descent, with the %K beneath the %D in 1 and 2 and above the %D in 3. Notice how the %K in stochastic 3 is rolling over. Based upon positioning of the %K in stochastics 1 and 2, a mid-term bottom is not likely due to occur until the October to November time frame. The coming decline is going to be a bumpy and slow decline which will get many who think next years new highs are due to change their mind...
Figure 3
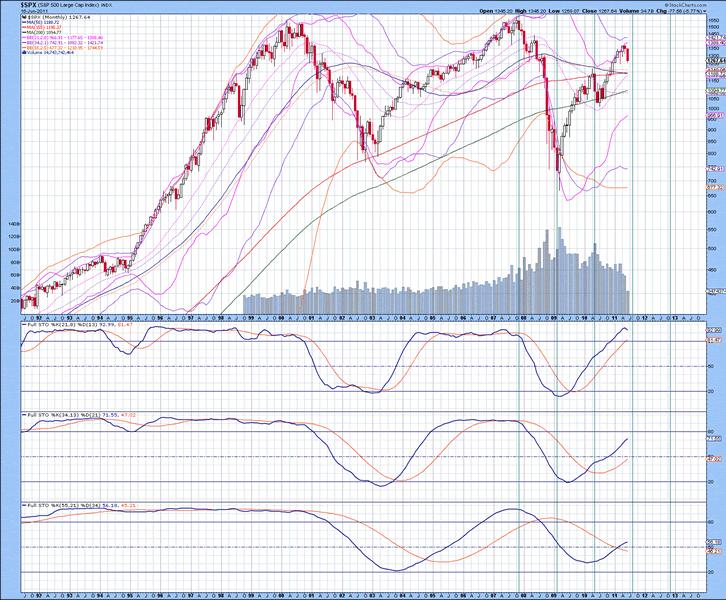
The monthly chart of the S&P 500 index is shown below, with the lower 55 MA Bollinger band well beneath the index, suggestive that the coming corrective sequence will come no where near the 2008 lows. Full stochastics 1, 2 and 3 are shown below in order of descent, with the %K above the %D in all three instances. Extrapolation of the positioning of the %K in stochastic 2 suggests a top is not due in the S&P 500 index until late 2012/early 2013. The S&P 500 index should make a new high in 2012, likely between 1650-1700. Martin Armstrong has a top due in 2015 with his modelling, whereas Elliott Wave suggests a sharp decline from late 2012/early 2013, lasting into 2014, possibly 2015. Only time will tell, but it is going to be some tough sledding.
Figure 4
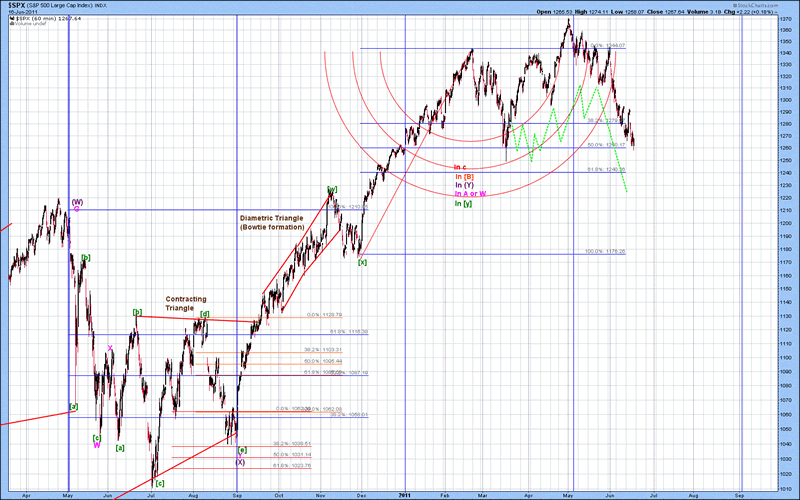
The mid-term Elliott Wave count of the S&P 500 index is shown below, with the thought pattern forming shown in green. The pattern did not follow the hypothesized path exactly, but now is playing catch up. Since the S&P 500 index did not not decline after the March top, there is more downside energy dissipation required to put in a low...this is why a bottom of some form is not due for at least 7-10 days. The expected low for this decline is between 1220-1240...we are nearly there. Next week, I will provide information about what sort of retracement to expect from the recent decline...those in mutual funds may wish to use the partial retracement to unload some funds until the October-November time frame.
Figure 5
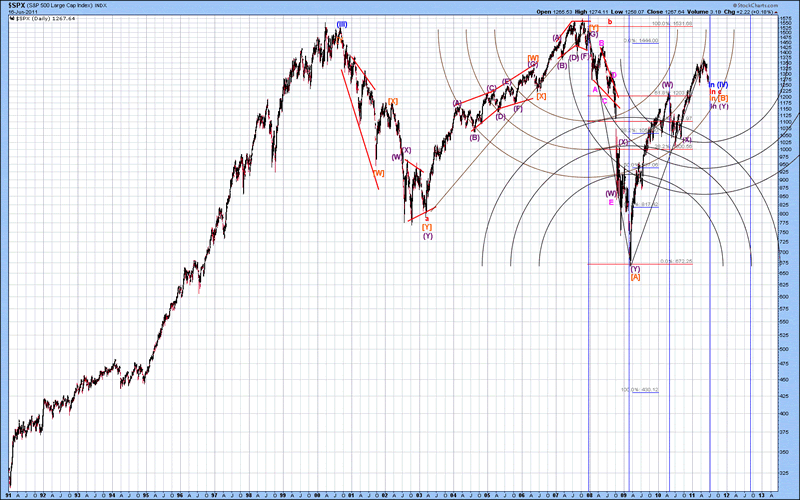
The long-term Elliott Wave count of the S&P 500 index is shown below, with wave (Y).[B] complete or wave (XX).[B] forming. There is no way to indicate which labelling scheme is correct, so allow some flexibility in the Intermediate Degree count ( indicated by the (Y) and (XX) brackets). Once wave [B] completes in late 2012/early 2013, wave [C] down will either be impulsive to complete a flat structure or it will take the form of a terminal impulse (declining wedge). If highs of 1650-1700 are put in place, then a decline to 850-900 will take 18-24 months to complete...12-18 months if it is a pure impulsive structure. Even a decline to 1000 at that point in time will hurt the pension funds. As subscribers know, precious metals and related stocks are expected to trade up next year into 2013 while the USD declines to 65-67.
Figure 6
Tracking multiple indices and graphs are important to collate and refine observations so that synergies can be visualized that otherwise would not be observed. As a side note, someone last week requested that I post something about CN Rail...I will do that over the weekend when I finish updating any index not yet covered during the week. Back tomorrow AM and have a great weekend.
By David Petch
http://www.treasurechests.info
I generally try to write at least one editorial per week, although typically not as long as this one. At www.treasurechests.info , once per week (with updates if required), I track the Amex Gold BUGS Index, AMEX Oil Index, US Dollar Index, 10 Year US Treasury Index and the S&P 500 Index using various forms of technical analysis, including Elliott Wave. Captain Hook the site proprietor writes 2-3 articles per week on the “big picture” by tying in recent market action with numerous index ratios, money supply, COT positions etc. We also cover some 60 plus stocks in the precious metals, energy and base metals categories (with a focus on stocks around our provinces).
With the above being just one example of how we go about identifying value for investors, if this is the kind of analysis you are looking for we invite you to visit our site and discover more about how our service can further aid in achieving your financial goals. In this regard, whether it's top down macro-analysis designed to assist in opinion shaping and investment policy, or analysis on specific opportunities in the precious metals and energy sectors believed to possess exceptional value, like mindedly at Treasure Chests we in turn strive to provide the best value possible. So again, pay us a visit and discover why a small investment on your part could pay you handsome rewards in the not too distant future.
And of course if you have any questions, comments, or criticisms regarding the above, please feel free to drop us a line . We very much enjoy hearing from you on these items.
Disclaimer: The above is a matter of opinion and is not intended as investment advice. Information and analysis above are derived from sources and utilizing methods believed reliable, but we cannot accept responsibility for any trading losses you may incur as a result of this analysis. Comments within the text should not be construed as specific recommendations to buy or sell securities. Individuals should consult with their broker and personal financial advisors before engaging in any trading activities as we are not registered brokers or advisors. Certain statements included herein may constitute "forward-looking statements" with the meaning of certain securities legislative measures. Such forward-looking statements involve known and unknown risks, uncertainties and other factors that may cause the actual results, performance or achievements of the above mentioned companies, and / or industry results, to be materially different from any future results, performance or achievements expressed or implied by such forward-looking statements. Do your own due diligence.
Copyright © 2011 treasurechests.info Inc. All rights reserved.
Unless otherwise indicated, all materials on these pages are copyrighted by treasurechests.info Inc. No part of these pages, either text or image may be used for any purpose other than personal use. Therefore, reproduction, modification, storage in a retrieval system or retransmission, in any form or by any means, electronic, mechanical or otherwise, for reasons other than personal use, is strictly prohibited without prior written permission.
David Petch Archive |
© 2005-2022 http://www.MarketOracle.co.uk - The Market Oracle is a FREE Daily Financial Markets Analysis & Forecasting online publication.