U.S. Economy 2011 Mid Year Forecast Update
Economics / US Economy Jun 20, 2011 - 04:50 AM GMTBy: Mike_Stathis
 The story remains pretty much unchanged relative to what I have been discussing over the past several months.
Throughout our research publications I have been pointing to the impressive earnings from U.S. corporations. I have also noted numerous upward revisions in 2011 EPS, which of course implies a higher stock market. As a consequence, I have been bullish throughout this, as well as over the previous year. At the same time, I discussed my expectations of a weaker economy in the second half of the year.
Although we are now seeing early signs of expected weakening of an economy that has been propped up through artificial means, investors have jumped the gun a bit, perhaps as an excuse to trim down positions in advance of what is historically a weak period of market performance in the summer months.
Regardless how well the U.S. stock market has risen over the past two years, we cannot forget that the U.S. economy remains in a recession, which is just one month shy of the longest recession in over 100 years.
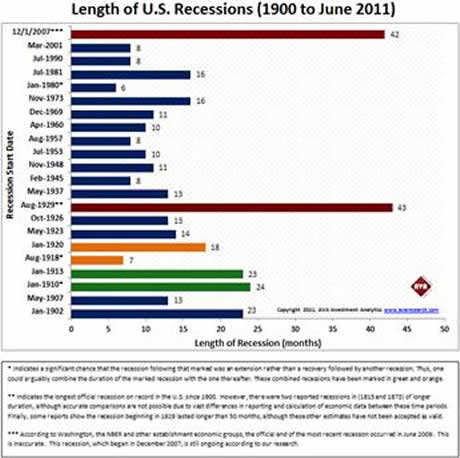
That’s right. You’re hearing it from me. There will be no “double-dip” recession as everyone has been discussing because such a term has no validity. This can easily be confirmed by anyone who truly understands economic cycle theory. Apparently, very few do.
Why do so many government and Wall Street economists, analysts, journalists and bloggers continue to discuss the potential for a double-dip recession?
See here to learn why the concept of a double-dip recession is invalid.
First, you have to understand that all government and Wall Street economists serve as cheerleaders for America’s fascist regime. Thus, they are the last source of reality. Regardless which side of the Washington mafia these hacks side with, merely by pointing to or casting aside thoughts of a double-dip recession accomplishes the same goal; fooling Americans to think that the recession ended in June 2009.
Why would opposing sides of the Washington mafia want to hide the truth?
If Americans truly understood reality, they would call for an end to America’s fascist government, which would threaten both families of the Washington mafia; the Democratic and Republican Parties. Already, the tea party movement, which was initially focused on a call to an end of the Washington mafia has been hijacked by the Republican Party. [1] [2] [3]
When you read an article by the Associated Press, Reuters, the New York Times, Washington Post, so on and so forth, the puppets of propaganda make certain to reference the lie that the recession ended in June 2009. As a means to thwart any consideration that America is in the midst of a depression, they utilize a simple psychological tactic, by referring to the recession as the “Great Recession,” as opposed to the another Great Depression. When I see these puppets use this term in their typical manipulative manner, I get sick to my stomach.
On the other hand, the perma-bear extremists are perhaps even worse, as they will never advise their Kool-Aid drinkers to buy into the stock market, regardless how much it declines.
I can already tell you such a debate will never take place, as the purpose of the propaganda campaign is not to have an open discussion about issues that matter most to the American people, such as the wars in the Middle East, healthcare, or the economy. The purpose of the media is to convince the American people that things are not as bad as they seem, or that things are much worse than they seem in order to fuel their agendas.
You see, it’s all about exposure. By ignoring unbiased experts, their voice is lost in the crowd of the media whores, none of which are on your side. As a result, most Americans will never truly realize what is going on until it is much too late. This is the way the game is played. But it only remains effective because the American sheeple continue to pay attention to the media.
When you read the various blogs, you will inevitably come across misguided individuals who follow the same lines preached these “more credible sources,” namely government and Wall Street economists quoted in the large corporate-government broadcast networks and newspapers such as the Associated Press, Reuters, the New York Times and Washington Post.
Now that I got that out of the way, I would like to state what I consider some important points:
- The recession which began in December 2007 is still in progress.
- This recession is one month shy of the first and most severe recession during the Great Depression.
- America is in the midst of its Second Great Depression.
- This depression will last at minimum until 2020; it could last much longer.
- There will never be a real recovery from this depression for most Americans.
- There will be no hyperinflation in the U.S. as a result of the depression.
- The depression will heighten due to inflation, although we will see short deflationary periods.
- Europe faces a high chance of a long deflationary period.
- The European Union will most likely be very different by 2020 than it is today.
- If Germany were to leave the EU, it would surely collapse.
- The vast majority of jobs lost (90%) since December 2007 (more than 9 million) will never return.
- The U.S. stock market no longer serves as a gauge of the health of the U.S. economy.
- The U.S. stock market will remain volatile for many years, with strong rallies and large corrections.
- Gold and silver prices will collapse to $300 to $400 and $7 to $12 at some point within the next several years.
- With rare exception, real estate has never been a good investment from a financial standpoint.
- Oil prices will remain high as long as the U.S. remains as war in the Middle East.
- It is very likely we will see World War III by or before 2020 (it could be argued to have already begun).
Now let’s take a closer look at the state of the economy and stock market.
In early May, I discussed elevated possibility of “at least a 4-5% correction in coming days” (Intelligent Investor and Market Forecaster). By the end of May, the S&P 500 and DJIA had corrected by 4.5% and 5.1%, respectively.
In the June issue of the Intelligent Investor and Market Forecaster newsletters, I detailed a scenario analysis, providing my best probabilities for the direction of the market. Thus far, this forecast has been spot on.
Let’s have a brief look.
“Overall, based on my current assessment, I expect the Dow to remain in a broad trading range between ******* to ******* for the remainder of the year. More specifically, I expect the Dow to remain in this range for 90% of the time, with a bias towards the ******* half of this range.”
Next, we restated what we have been saying for a few months…
“As we move into the second half of the year, I expect the combined impact of high oil and commodity prices, Japan, and rising inflation to weigh on the market.
However, rather than a reversal of economic and earnings momentum, I expect the combined effect of these variables to scale down the market upside first discussed in a market update released in mid-February (I discussed this downward revision recently).”
To clarify the last paragraph for those who are more recent subscribers, in other words, rather than a Dow *******, I expect a trim down to ******** due to the issues that will materialize in the second half of 2011.”
Also in the May issue, we stated the following...
“The final two charts in this series illustrate how the Dow continues to remain within a very steep bullish trading band. Notice the ******** made in the Dow between ******* (fourth chart) and ******* (fifth chart). This is a very ******** move as mentioned. However, it also increases the chance of at least a 4%-5% correction in coming days.”
“So what should you do?
I would not be adding any new money into the market at this point. I would wait for a correction.”
We also stated that you might want to sell some positions to avoid the expected downside (exact quote not included because it points to our longer-term forecast in the market).
Despite the continuation of earnings surprises, I still feel the market is overvalued by a very large amount because it has rallied strongly in response to earnings reports. But once again, the valuation methods I focus on are best utilized to forecast market bottoms during bear markets.
On the other hand, I also look at more traditional valuation metrics such as PE ratios and so fourth in order to gauge market sentiment. Market valuation techniques alone do not help us much. You must also look at sentiment because it can help you spot trends early on.
If you are not able to gauge market sentiment and you are aware of the macroeconomic risks (of which there are many) then you could be sitting in cash for ten years waiting for a collapse while the market soars. This is the precise situation many investors have found themselves in after listening to the perma-bear snake oil salesmen plastered throughout the media.
At the same time, many investors who have listened to the perma-bulls have found themselves selling towards the bottom (in panic) and have only recently bought back into the market.
There are numerous methods to determine earnings and valuation, so it is very important to understand what the majority of institutions utilize as so you can determine if they will be disappointed or pleased with the data.”
Continuing...
“So how do we play this?
The higher the Dow is going into the second half of the year, the more **********, and vice versa.
If the market corrects downward (in advance of these risks) going into the second half of the year (say back down to the ******* level), I would be a strong ******* of US equities (a correction down to the ******* level would add to this ****ish strategy).
In contrast, as the market ************************, you should *************************.”
Then, in the June issue, we write…
“Currently, the market is entering the second half of the year already having corrected by around 5% over the past two weeks. Thus far, this correction has not been significant relative to the anticipation of an economic slowdown in the eyes of the consensus of investors.
The current ~5% correction seen over the past month is **********************. Thus, I expect ************ over the next few weeks.
I feel the odds are quite high (85% certainty) that we will see (the Dow Jones reach) ********. That would place the DJIA at *******.
In addition, the odds are fairly high (70% certainty) that the DJIA will head to******** from here. Finally, I estimate a 50:50 chance that the DJIA will ****************, placing the Dow at ********.”
Since the catastrophe in Japan began, analysts had been downplaying its impact to both Japan and the global economy. However, I previously stated that the effects of Japan’s lingering catastrophe were being downplayed relative to estimates from Wall Street and government officials. I maintain this view.
In fact, the IMF has recently made radical modifications to Japan’s 2011 GDP growth, placing the country in recession territory. [6]
While I do not feel that $100+ oil has been a significant drag on the U.S. economy (at this point), I have been discussing that it has added a good deal of pressure to emerging economies, especially in Asia and South America. Not only have high fuel costs excessively increased food and transportation costs in these nations, the overall inflationary effects have also heightened wage pressures.
Combined with peak capacity utilization seen in some emerging nations (Brazil and Indonesia), it should be clear that inflationary pressures are spreading across the globe, albeit slowly. Additional inflationary pressure has mounted as the result of large capital inflows from financial institutions and other investors looking to take advantage of high interest rates in Brazil, India and other nations.
The various hacks and clowns have chosen to focus on QE2 because it has progressed into a “drama” phrase. The reality is that QE2 has not resulted in any DIRECT inflation in the U.S. While it has heightened inflation in many parts of the globe (which has spilled over into the U.S.) there are many other issues of higher concern. Thus, if you have been duped by the QE2 drama, you have been paying attention to the wrong sources.
Overall, earnings from U.S. corporations continue on a blistering pace, with pre-crisis highs in sight. However, earnings have weakened a bit over the past few weeks. Disappointing earnings and forward guidance from technology blue chips like Hewlett-Packard, Microsoft, Cisco and others are clear signs of more stalling ahead.
Waning guidance from retailers was expected, due to soaring cotton pricing. For some reason investors had not adequately factored this into the market prior to last month when soft line retailers collapsed after missing earnings and reporting weak guidance. However, aside from a few mishaps, earnings generally remain strong although this momentum is clearly decelerating.
Meanwhile, Southeastern Europe remains in a free fall, while much of northern Europe is doing relatively well for now. Emerging nations in Europe promise to add additional significant burden to advanced EU members (Germany, Denmark, Switzerland, and Sweden) through bailouts for weaker EU members. Moreover, strength seen in the franc and krona continues to weigh on export trade from these nations. Brazil is facing a similar problem. I see no positive developments in the UK.
From an absolute sense, the U.S. economy has shown very little improvement from 2008. We can only see a relative improvement from the trough in late 2008 to early 2009. But these relative improvements have come from taxpayer subsidies. Even still, there have been virtually no improvements in the labor market. Meanwhile, the real estate market continues to weaken.
Perhaps most worrisome is the fact that the U.S. economy has become highly leveraged while improvements have been absent.
What does all of this mean?
Earnings are strong, yet the economy has shown no real signs of improvement?
Remember, earnings are the only thing that matter to the stock market; well mostly. Interest rates also matter but it would appear that they won’t be a consideration for some time.
Also keep in mind that the stock market moves largely based on earnings; reported and forward estimates. Thus, it is critical to understand the ability of corporations to meet future earnings expectations. This is where the importance of the economy comes into play.
Is it possible to have strong earnings in a weak economy?
With each given year, this is becoming more possible due to the decoupling of the U.S. economy with the business side of corporate America.
How does that make sense? After all, those of us residing in the U.S. have always heard that the stock market serves as a gauge of the health of the economy, right?
That may have been true in the past, but things began to change once NAFTA was passed. As discussed in America's Financial Apocalypse nearly 5 years ago, as U.S. corporations shifted millions of jobs overseas, they have also shifted entire facilities. As a result, more than three billion consumers in Asia (many with high savings and low debt), corporate America has been gradually shifting its revenue dependency overseas. This trend will only add to the exportation of good jobs overseas.
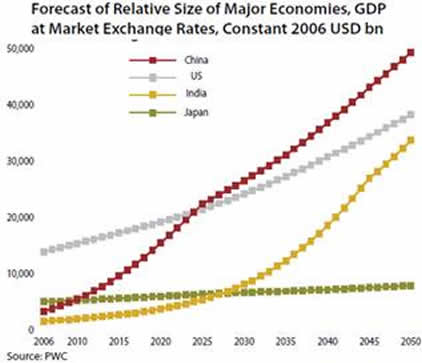
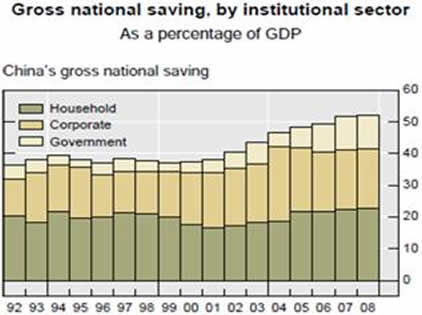
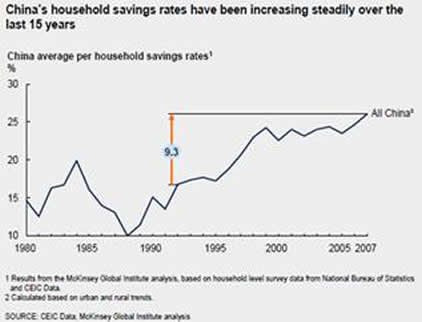
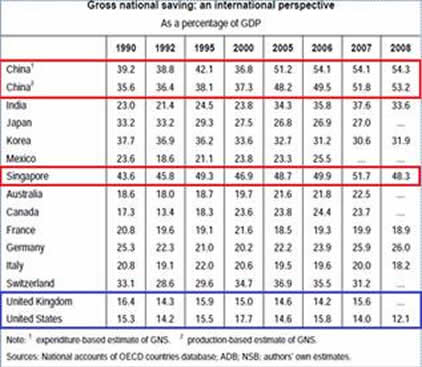
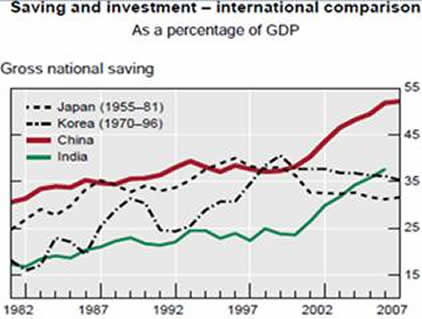
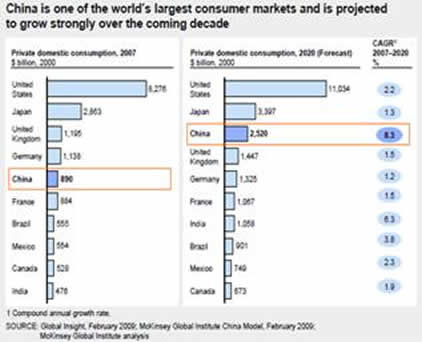
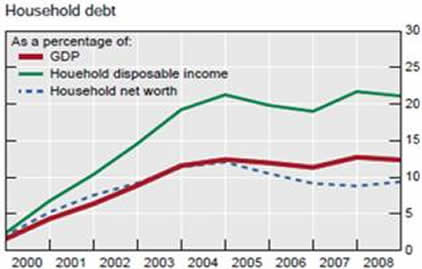
From this chronic relationship alone, living standards for the vast majority of Americans will be ratcheted down a couple of notches indefinitely. As I have discussed in the past, this is a trend that promises to strengthen each year. And it poses a particularly daunting scenario for U.S. workers.
The consequences of the historic securities fraud by Wall Street, and Washington’s multi-trillion dollar banking bailout and stimulus packages ensure a more downside to living standards. Washington’s long-standing fiscal irresponsibility and one-sided policies supportive of corporate America will continue to whittle away the living standards for the majority of Americans indefinitely, or until Washington decides to steal wealth from other nations through wars.
Some might counter that the U.S. has already begun stealing wealth in the Middle East. However, the wealth it is stealing from Iraq represents a wash (at best) due to the trillions of dollars being wasted on this war. The only winners here are the insiders connected to Washington, who bilk taxpayers via excessive expenses billed by private contractors and other insider profiteering. George Bush Senior’s association with the Carlyle Group serves as a role model for this other level of fraud. [7]

Perhaps the most tragic consequence of these wars, second only to the unneeded loss of lives, is the fact that Washington and the media have made puppets out of most Americans. Those who stand to lose the most are actually doing the dirty work for the profiteers. They have managed to fool the tea party and virtually every other American who is fed up and frustrated.
Recently, trustees for the Medicare trust fund announced that the fund is now projected to exhaust its funds in 2024, not 2029 as estimated last year. As well, trustees for the Social Security trust fund announced that the Social Security retirement program will run out of money in 2036, not 2037 as previously thought.
Those who have been bought off by the healthcare mafia, the corporate elite and the fascist regime in Washington have convinced the American people that they must accept austerity measures, such as cuts to Medicare and Social Security. However, the reality is that Americans are allowing the war in the Middle East to siphon off their Medicare and Social Security.
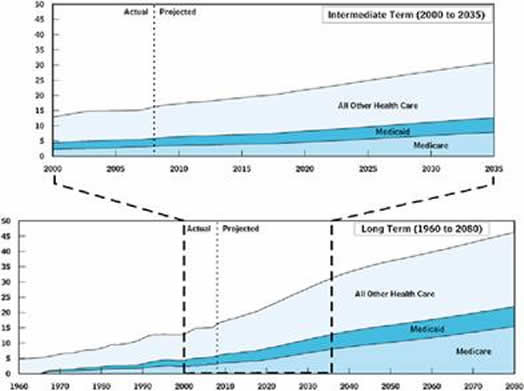
Finally, as I have shown many times in the past, if the U.S. limited its annual healthcare expenditures to that seen in Canada, the UK, Japan, and Europe on a per GDP basis, it would actually begin recording annual budget surpluses starting in 2020.
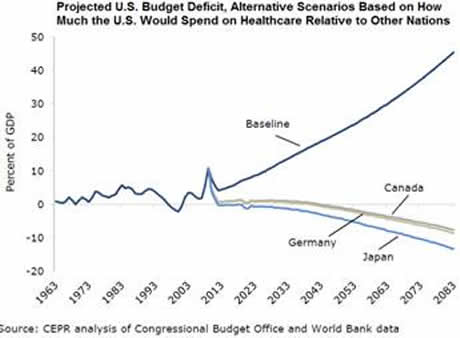
Rather than address the real problem threatening the insolvency of Medicare and Medicaid, Washington has fooled the American people to think that these entitlement programs are bloated and unsustainable due to their inherent structure. This is simply not true.
The main reason for the dire financial state of Medicare and Medicaid is due to unchecked healthcare inflation, which has risen by double digits over the past decade.
Meanwhile, Social Security can easily be fixed by raising the payroll tax ceiling to around $150,000 of wages. However, Washington has chosen to delay this simple fix to Social Security because they know that the longer they wait, the more difficult it will be to fix. This will build momentum for privatization of Social Security, which as I discussed in America's Financial Apocalypse, would add nearly $1 trillion in fees to Wall Street, all while placing these assets in the hands of the retail financial markets. That means higher fees and lower returns. As well, it promises to shortchange minorities and women.
This might seem obvious to some, but defense spending has been the largest budgetary item in the U.S. for several years. Yet, when Washington discusses the need to reduce the debt, they never discuss real cuts to defense spending other than a reduction in VA benefits.
America’s media monopoly plays along with the illusions pumped out of Washington by dramatizing the fake death of bin Laden, all while spicing it up with mention of bin Laden’s porn collection. Yet, no one in the media ever bothers to ask what benefits America is receiving from the wars in the Middle East, TSA and DHS procedures. As a result, most Americans never ask these questions because the media has complete control over their minds.
Do you really think the terrorist organization known as Al Qaeda exists?
Do you really think “terrorists are out to get us because they want to destroy our way of life?”
Do you really think Middle Eastern “terrorists” were responsible for 9-11?
If you believe this rubbish, I would advise you to pull all of your money out of the stock market forever, because you are likely to lose a great deal more. Naïve people stand a poor chance to make money in the capital markets. If you want to make money in the stock market, one of the first skills you must have is the ability to decipher criminal psychology and psychological manipulation because these are the primary forces responsible for securities price movements.
At the end of the day, the American people only have themselves to blame for their diminished living standards because they have been suckered to believe the countless lies from Washington and the media, all while lining up for obvious distractions in order to keep real news from being broadcast. The current obsession with Congressman Weiner is a perfect example of this tactic.
Who gives a damn about Weiner and his wiener? Report on it once and let that be the end of it. Move on to issues that matter.
What will the U.S. media obsess on as its new scandal once it has played out the Weiner circus show?
Will there be a new sex scandal?
Maybe they will “expose” Bernie Madoff’s obsession to porn. I think you get the picture.
The Zionist-controlled media machine continues to replace celebrity gossip and TMZ trash with real news. This is being done of course in order to keep the masses distracted, uninformed and to encourage them to stop thinking so that they will accept without question everything the media tells them. This mechanism applies to the financial media as much as the general media.

Accordingly, the American people are also to blame for losing their retirement savings to Wall Street fraud because they have not stormed Washington in protest for criminal indictments, nor have they demanded real Wall Street reform. And they keep watching CNBC. They keep reading the New York Times.
Have you forgotten how these media organizations hid, denied and lied about the realities of the economic collapse?
Then we had one of Larry Kudlow’s hack’s from CNBC, Don Luskin, “Mr. Delusion,” who wrote an op-ed for the Washington Post on Sunday September 14, 2008, discussing how good the economy was. See here.
The next day, Lehman Brothers collapsed while Merrill Lynch was reportedly purchased by Bank of America. However, I immediately reported the reality that Bank of America was forced to buy Merrill in what I labeled a bailout disguised as a buyout, designed by the Federal Reserve and Treasury.
The following day, AIG was bailed out.
The following week, Washington Mutual was seized (albeit wrongly and illegally). I immediately sent a formal complaint to the SEC regarding the illegal activities surrounding this scam. [8]
A week later, one of the American sheeple who have been brainwashed to support America’s two-party mafia in Washington posted a comment on Luskin’s epic article…
LFforMcCain wrote:
“Why aren't there MORE like YOU out there?! I'm so sick of the gloom & doom when in fact key indicators show it's NOT THAT BAD! People nailed McCain to the cross when he said the fundamentals of the economy are strong. He was absolutely right! But does anyone come out and say that. Not in the MEDIA they don't! How shameless & shameful that we have come to this. THANK YOU FOR TRYING TO SET THE RECORD STRAIGHT!”
9/21/2008 8:40:17 AM
You should be asking the Washington Post, New York Times, Associated Press, Reuters, the Wall Street Journal, Barron’s, Forbes, CNBC, FBN and the other members of the media monopoly why they have banned me. If they had let me speak, no one would have lost a dime. [9] [10] [11]
In fact, people could have made a good deal of money just by shorting Fannie and Freddie, as I recommended in Cashing in on the Real Estate Bubble (2007).
As you might imagine, it’s become emotionally draining to see your own people be taken for the fools they are over and over and over.
Before there was any discussion by economists, the media and the media’s so-called experts, I laid out a detailed analysis forecasting a depression BEFORE the economic collapse began, showing how America’s three entitlement programs would add to America’s Second Great Depression (America’s Financial Apocalypse, 2006).
In addition, I provided a forecast of 30% to 35% collapse in median home prices, millions of foreclosures, Dow Jones 6000, the bailout of Fannie Mae and Freddie Mac and much more in this book. Yet, the media continues to ban me. What’s particularly ludicrous is that this book is still not even known. In contrast, the masses have read useless books written by reporters dramatizing the same events that they failed to report on when they occurred. People need to wake up.
Now that the accuracy of my forecasts has positioned me even further ahead of the pack, I have received absolutely ZERO interest from any form of media whatsoever. Prior to the collapse, I had received some interest. Isn’t this odd?
Let me explain to you what is going on here. The media doesn’t want or need a real expert who has no bias and cannot be bought off. Instead, they have their own hacks, most of which have very little if any credibility, and all of which have horrendous track records. Instead of airing forecasts and insights of competent and unbiased analysts and strategists, the Zionist-controlled media has positioned their Jewish colleagues as experts.
In reality, most are nothing more than snake oil salesmen. Some are hacks for Wall Street, Washington and corporate America. Others are working for gold dealers. In reality, they are all extremists, all with agendas, all with terrible track records.
One on side of the debate, you have the perma-bull extremists representing Wall Street and democratic interests, selling you hope. They make money leveraging this bull to their audience. On the other side you have perma-bear extremists representing gold bugs and republican interests. They too make money by leveraging this trash to their audience. Either way, all extremists are useless and often dangerous.
You aren’t going to find any bloggers or self-proclaimed financial professionals who spend most of their time blogging propaganda make mention of me or the accuracy of my forecasts either, because most of them are simply followers of the media, so they only know names like Roubini, Schiff, Cramer, etc. – none of which can come remotely close to my track record.
They are all like monkeys; monkey see, monkey do. It’s the media Macarena. [12]
Others know who I am and realize my track record is unmatched, but they want to stay away from me for fear of being exposed for the clowns they are. Some even fall into both categories. [13]
If you want to align yourself ahead of the curve, you need to stop wasting time on chumps. That means you must be able to recognize chumps.
U.S. Debt Credit Ratings
Last month, Standard & Poor’s downgraded the outlook for its credit rating of U.S. debt, emphasizing the need for Washington to raise the debt ceiling while implementing austerity measures prior to the 2012 election.
On June 2, Moody’s followed suit with warnings that U.S. debt would come under ratings review with downward bias if the debt ceiling is not raised and measures to control spending have not been passed soon. All this has done is fuel the momentum to effectively squash Medicare. I smell something fishy with regards to the timing of these announcements by the rating agencies.
Inflation
The Consumer Price Index (CPI) rose 0.4% in April. Of more relevance, the CPI rose at a 6.2% annualized rate over the last three months. Elevated energy prices continue to drive headline inflation. Although prices are down significantly from April, energy pricing advanced in May after bottoming earlier in the month. Over the past three months, energy prices have risen at a 42.8% annualized rate.
The core CPI rose 0.2% in April. In 2011, the monthly core rate of inflation has remained stable, varying between 1.6 and 2.4% annualized since December. In part, the low rate of core inflation continues to be a price restraint in rent and owners’ equivalent rents resulting from the oversupply of housing. The price of owners’ equivalent rents has risen 0.1% in each of the last seven months at a 1.2% annualized rate.
Transportation prices rose 1.4% in April mainly due to increased fuel prices. Of particular interest, the price of new vehicles has risen at an annualized 10.1% rate in the last three months, adding one-quarter of a percentage point to the 2.1% annualized core rate of inflation. However, manufacturers have changed the timing of new car releases which is likely to alter the seasonal adjustment. The price of new cars has risen only 2.2% over the last year.
Medical care prices rose 0.4% in April, and at a 4.1% annualized rate over the last three months. Medical care commodity prices (mainly for prescription drugs) have risen at a 6.8% annualized rate over the same period.
Apparel prices rose 0.2% in April. Clothing prices have declined by a 4.9% annualized rate over the last three months, compared with a 4.9% annualized rate of inflation for the three months ending in January. This should come as no surprise if you recall my discussion of the reaction by retailers to high cotton and other textile prices.
Education and communication prices rose 0.1% in April. Education prices have risen at a 1.4% annualized rate over the last three months, while communication prices have declined by a 0.9% rate. Education prices have increased by a 5.8% annualized rate over the last 10 years, versus a decline of 1.1% annually in the price of communication.
Over the last two years, inflation in the Producer Price Index (PPI) for finished goods has advanced more than three percentage points faster than the CPI (5.9% versus 2.7%). Two main factors account for this difference.
First, the PPI is a goods index, so it does not measure inflation in services. As a result, food and energy account for much more of the PPI the CPI. Furthermore, this makes the PPI more sensitive to fluctuations in these prices. When non-core prices collapsed in late 2008 and early 2009, the PPI declined by a 9.7% annualized rate over nine months.
In contrast, the CPI decreased to an annualized rate of only 3.8%. Thus, the more recent rise in the PPI relative to the CPI is a result of soaring oil and food prices.
Second, the low inflation in rents has helped keep down core consumer prices, but not producer prices since the PPI does not measure services. In other words, the PPI has not benefited from the deflationary adjustment due to the correction in housing prices and equivalent rents. As a result, over the past 24 months, the core PPI has risen by only 3.1% (1.5% annualized) while the core CPI minus shelter has gone up 3.8%.
Manufacturing and Consumption
The Philadelphia Fed manufacturing index dropped to 3.9 in May from 18.5 in April, well below the consensus (20.0) and most Wall Street forecasts. The new orders index fell to 5.4 from 18.8, the shipments index sank to 6.5 from 29.1, and the supplier delivery time index dropped to -2.3 from 11.2.
U.S. manufacturing activity expanded in May at the slowest pace in 20 months, confirming a slowdown in economic growth.
The Institute for Supply Management’s (ISM) index of manufacturing activity fell to 53.5% in May from 60.4% in April. Since the index remained above 50, it marked the 22nd straight month of growth (according to the ISM). However, the decline in May was the biggest since 1984.
Construction spending for March (slightly) increased seasonally adjusted annual rate to $765 billion, up by only 0.5% from an 11-year low of $761 billion reached in February.
Although manufacturers in most industries reported growth in May, they also reported problems due to the rising costs of fuel, chemicals, metals and other inputs.
High prices for oil and other commodities have also dampened consumer spending, which has led to less demand for factory goods. However, consumer spending is still respectable given the rising costs of food, energy, and healthcare in the face of a 1.6% decline in real wages over the past two years.
Three industries contracted: printing; furniture; and food, beverage and tobacco. All three are closely linked to spending by consumers.
And an index of manufacturers' inventories swung from growth to contraction. That suggests manufacturers are replenishing their stockpiles at slower paces after selling off excess goods that they produced during periods of stronger demand.
The survey also found that the overall economy grew for the 24th straight month. This of course is pure fantasy based on an isolated metric.
Housing Market
On May 31, 2011, Standard & Poor’s released its data through March 2011 for its S&P/Case-Shiller Home Price Indices. According to this data, the U.S. National Home Price Index declined by 4.2% in Q1 of 2011, after having fallen 3.6% in Q4 of 2010. The Index hit a new recession low with the Q1 data, and posted an annual decline of 5.1% versus Q1 of 2010. Nationally, home prices are back to their mid-2002 levels.
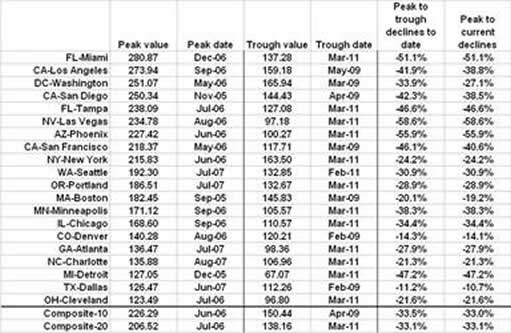
Based on the latest data, the 10– and 20-city composite pricing has declined from peak to trough by 33.5% and 33.1%, respectively, making the real estate collapse worse than the 31% decline seen in America’s First Great Depression in the 1930s (there was at least one other depression prior to this time in the 1800s, but the characterization is difficult due to vastly inadequate record-keeping and much difficult methods of data collection and calculation). This latest decline in home prices is in line with my original forecast of a 30% to 35% decline made in 2006.
Folks, if an individual isn’t providing forecasts that hold over time, they are really not providing forecasts. When you see individuals changing their forecasts month after month, you must understand that these are not forecasts. They are broadcasts. The difference is huge. Robert Shiller is not a forecaster, nor are any of the others you see plastered in the media. They are broadcasters disguised as experts. Their only expertise is in marketing and sales.
The Case-Shiller 20-City index fell by 0.8% in March, pushing the index to a new post-bubble low. Over the prior six months the rate of monthly decline averaged more than 1.0%. In nominal terms, the March number is 0.8% below the previous post-bubble low made in April 2009. In real terms, the March number is 5.4% lower.
The recent decline in housing prices has wiped out nearly all of the increase in real prices since the beginning of 2000. The real value of the 20-City index is currently only 5.2% above its January 2000 level.
Those who read Cashing in on the Real Estate Bubble (2007) might recall my forecasts for the housing market and recommendation for buying a home. I basically said that you should look to buy a house based on prices seen in 2000. I went on to forecast that housing prices would decline to pre-1999 levels in one or more articles published in 2008. However, this was prior to the various subsidies jettisoned by Washington and the Federal Reserve. While these programs have been ineffective, they have bought some time. The effect of this time delay has extended the slope (representing the historical fair value) for housing prices such that the 2000 pricing level is likely to represent a bottom in most markets.
Based on the March data from Case-Shiller, prices have declined in real terms for 12 of the 20 cities since 2000, with both Portland and Seattle showing gains of just over 1.0% over this 11-year period. The biggest losers have been Atlanta, with a real price decline of 25.1%; Las Vegas at 26.0%; Cleveland at 26.3%; and Detroit with a real price decline of 48.9%.
Since 2000, nearly all of the cities in the bottom tier of the housing market have shown the worst performance. In other words, homeownership has been an especially bad investment for moderate-income families over this 11-year period. Since 2000, real prices for the bottom third of the market fell in San Francisco and Tampa by 14.7% and 15.1%, respectively. In Chicago, Minneapolis, and Las Vegas the real declines were 33.3%, 35.8% and 39.2%, respectively.
The biggest declines reported for the bottom tier of housing were seen in Phoenix at 46.6% and Atlanta at 53.1%. (Data for pricing tiers is not reported for Cleveland and Detroit because the samples are too small. However, I would expect these cities to top the real price declines seen in Phoenix and Atlanta.)
Remember that these figures refer to the drop in real house prices since January of 2000. Price declines from the peak in 2006 are much more severe in most cases.
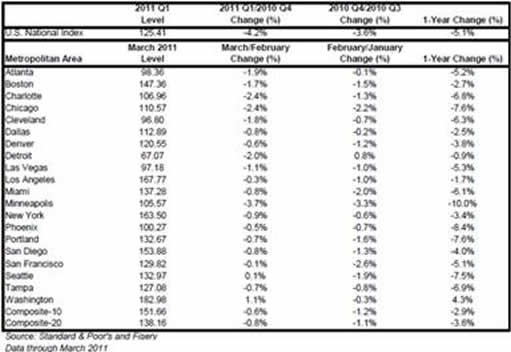
The March data show prices dropping in 18 of the 20 cities, with Seattle (0.1% increase) and Washington, DC (1.1% increase) posting the only gains. Prices are now 4.3% higher in Washington than a year ago. Thus, DC is the only city with a year-over-year increase. In previous issues, I discussed why the DC housing market has fared relatively well. Remember, Washington has been on a hiring spree (although it has trailed in job additions over the past year).
The biggest price declines in March were seen in the Midwest. Housing prices fell by 1.8% in Cleveland, 2.0% in Detroit, 2.4% in Chicago, and 3.7% in Minneapolis.
Over the last three months prices have fallen at a stunning 22.5% annual rate in Chicago and a 34.6% annual rate in Minneapolis. In both cities the bottom tier has accounted for a disproportionate share of decline, with price declines in March by 9.9% and 6.4%, respectively.
Even more alarming, over the last three months prices in the bottom tier have fallen at a 50.4% and 55.9% rate in Chicago and Minneapolis, respectively.
Prices in Charlotte declined by 2.4% in March, boosting the annualized rate of decline to 18.0%. In Boston prices fell by 1.7%, raising its annual rate of decline to 12.9%.
While prices are likely to continue downward over the next several months, I feel that many of the cities in this index are near their bottom. The April data on pending home sales was extremely weak.
The chart below depicts the annual returns of the U.S. National, the 10-City Composite and the 20-City Composite Home Price Indices. The S&P/Case-Shiller U.S. National Home Price Index recorded a 5.1% decline in the first quarter of 2011 over the first quarter of 2010. In March, the 10- and 20-City Composites posted annual rates of decline of 2.9% and 3.6%, respectively.
Thirteen of the 20 MSAs and both monthly Composites saw their annual growth rates fall deeper into negative territory in March. While they did not worsen, Chicago, Phoenix and Seattle saw no improvement in their respective annual rates.
In March 2011, 12 cities - Atlanta, Charlotte, Chicago, Cleveland, Detroit, Las Vegas, Miami, Minneapolis, New York, Phoenix, Portland (OR) and Tampa - fell to their lowest levels as measured by the current housing cycle.
The recent data has caused many economists to claim a “double-dip” in the housing recession. This is complete nonsense, as we never rebounded from the slump to begin with.
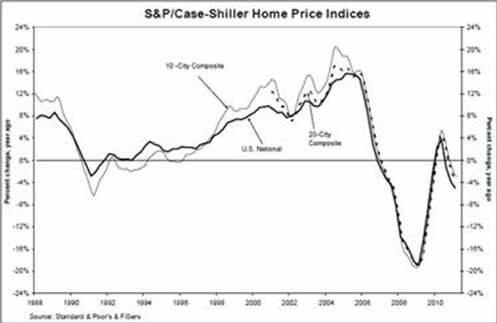
As discussed in previous issues, the relative rebound in prices seen in 2009 and 2010 was largely due to the first-time home buyer’s tax credit. After excluding the results of these subsidies, there has been no recovery or even stabilization in home prices at any time since the decline began in late 2006.
The chart below shows the index levels for the U.S. National Home Price Index, as well as its annual returns. As of the first quarter of 2011, average home prices across the United States are back at their mid-2002 levels. The National Index level hit a new low in the first quarter of 2011, declining by 4.2%. It is now 5.1% below its 2010Q1 level.
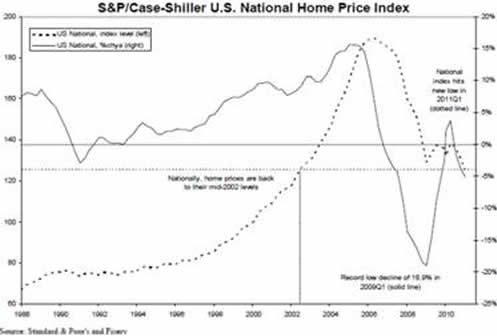
Eleven cities and both Composites have posted at least eight consecutive months of negative month-over-month returns. Of these, eight cities are down 1% or more. The only cities to post positive improvements in March versus their February levels are Seattle and Washington D.C. with monthly returns of +0.1% and +1.1% respectively.
The table below summarizes the results for March 2011. The S&P/Case-Shiller Home Price Indices are revised for the 24 prior months, based on the receipt of additional source data.
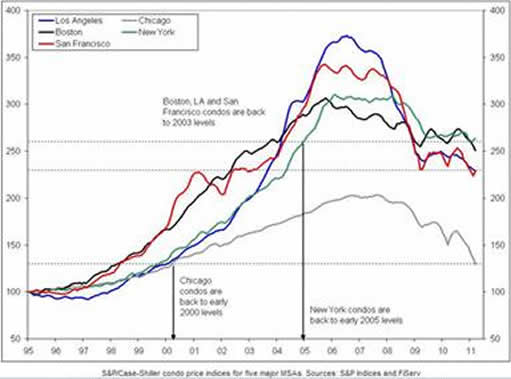
Here, I show historical Case/Shiller condo price data for the five major cities (in terms of economic power) since the start of the housing bubble. As you will see, relative to the overall residential housing price decline, condo prices have held up better. The following data is approximate. Since reaching a peak, condo prices have declined:
...in Los Angeles by 37%
...in Boston by 18%
...in San Francisco by 32%
...in Chicago by 37%
...in New York by 16%
Before we take a closer look at each city, it is important to consider possible reasons for the smaller decline seen in the condo market in most of these cities.
First, consider that most condo owners tend to be singles or younger married couples without children. Moreover, both spouses tend to be income earners. Thus, overall, they have more money they can devote to housing.
Second, condos tend to be situated in densely populated areas where jobs are plentiful, rather than in remote areas. This too helps increase the pool of available buyers which boosts the market price.
If you are wondering why New York suffered the smallest decline in condo prices, I should remind you that the villains (Wall Street) came out of this mess as winners.
The table above summarizes the Case/Shiller housing data for the 10– and 20-city composites, from peak to trough. Based on the latest data, the 10– and 20-city composite pricing has declined from peak to trough by 33.5% and 33.1%, respectively. It seems very likely that my original (worst-case scenario) peak-to-trough forecast of –35% will materialize over the next several months.
Notice that the largest decline thus far has occurred in Las Vegas, followed by Phoenix and Miami. The smallest decline has been in Dallas followed by Denver.
Next I show the Case/Shiller data plotted for each city in the 20-city composite (since inception of the data for each city) to give you a better idea how each city has fared.
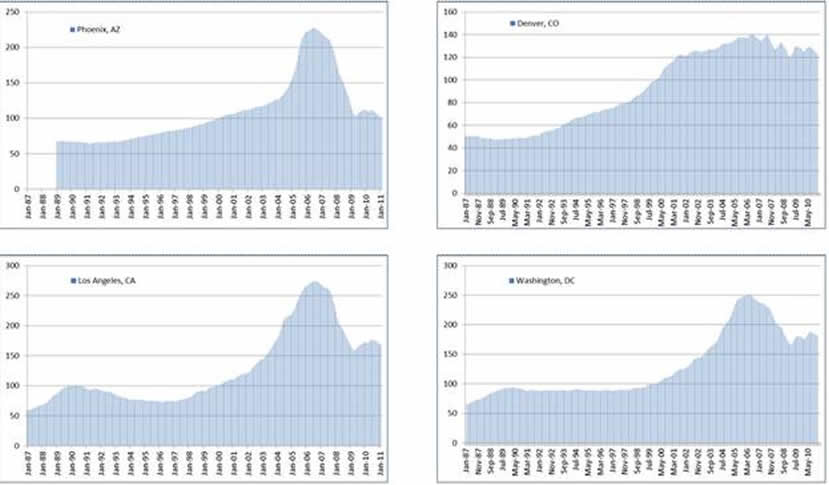
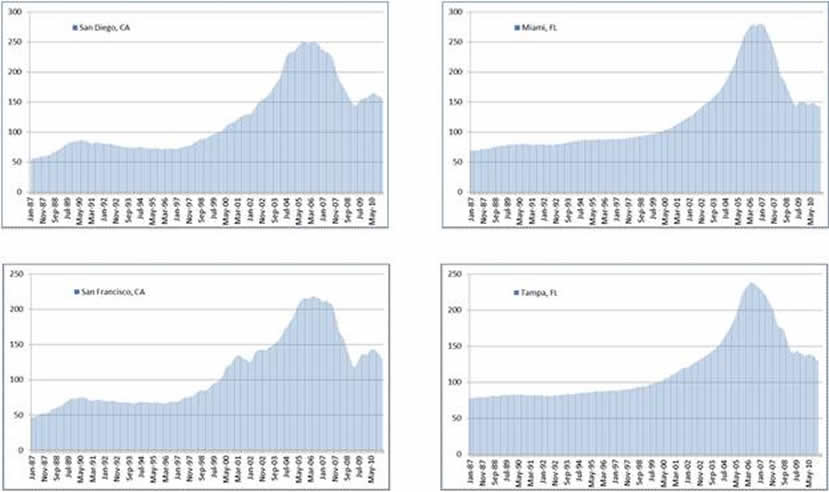
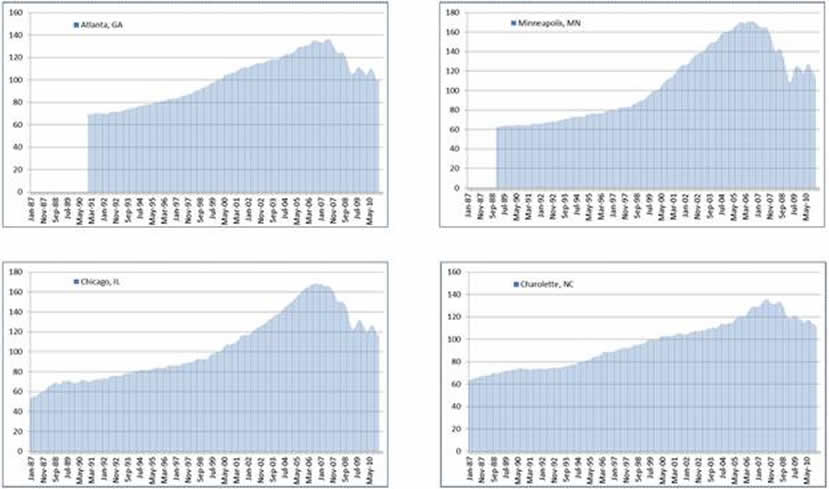
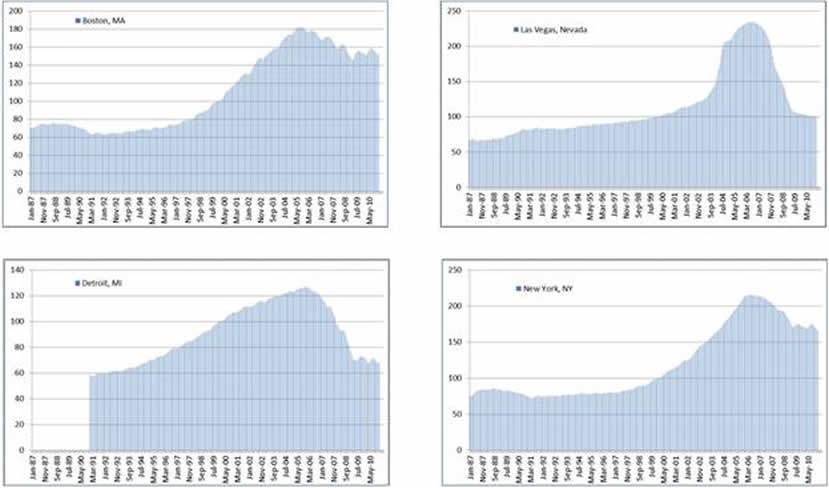
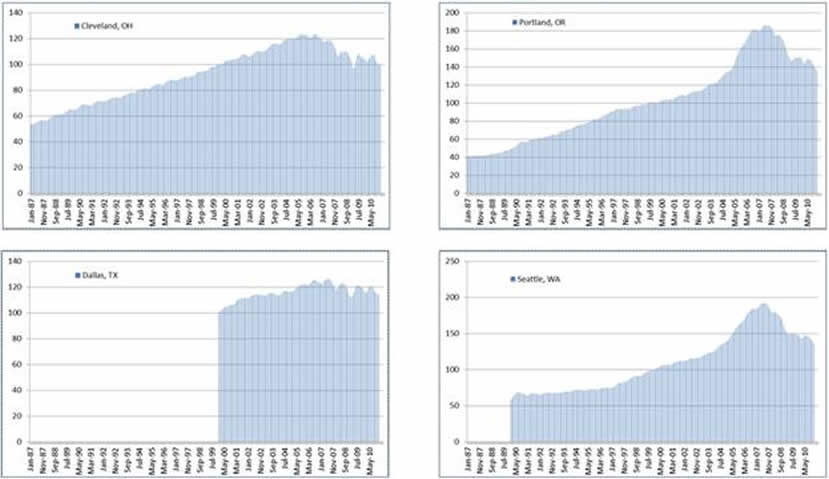

As you can see, the data varies greatly from city to city.
In order to understand where housing prices in each city are headed from here, one must have a really good understanding of local and broad economic variables. I can tell you that every single real estate consulting firm I have come across has been absolutely clueless. And I have come across some very prominent firms.
As expected, the Pacific region has been hit hardest by the correction in the real estate bubble, along with Florida.
In contrast, the Sunbelt states have fared the best. The reason for this is quite simple. The Pacific region experienced the largest increase in housing prices, while the Sunbelt states experienced the smallest price increase.
Other regions which experienced a large rise in real estate prices (such as New York City) have been able to keep a good part of its real estate bubble inflated due to the impact of the financial industry. Smaller financial centers, such as Boston, Greenwich and Stamford, Connecticut have also fared well for the same reason.
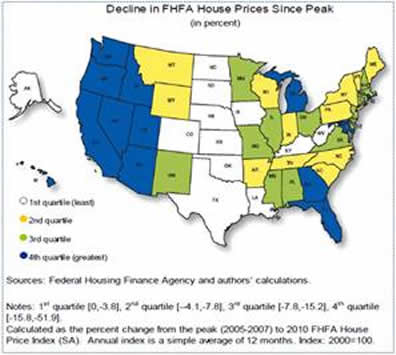
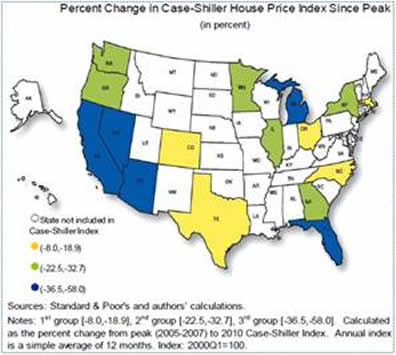
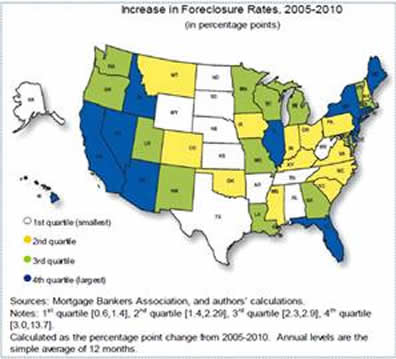
Over the past several months I have made mention of the shadow inventory of houses. When the media makes mention of the shadow inventory, it typically only discusses those homes that are in late stages of the foreclosure process.
The next chart shows the total potential shadow housing inventory based on payment status and foreclosures. As you can see, this number is approaching 6.5 million, and rising. This number represents approximately 10% of all single family residential homeowners in the U.S.
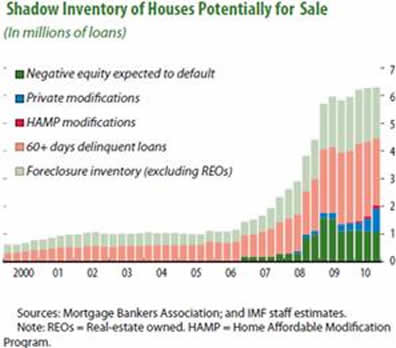
Certainly, only a small percentage of the 5.3 million homes not already in the foreclosure process will end up on the auction block. Furthermore, the process will be spread through several years. However, this data alone ensures there will be several more years of excessive foreclosures.
In addition, there are other elements of the shadow inventory to keep in mind. I have discussed these points in the past.
First, there are millions of homeowners who have wanted to sell but have chosen to wait for the market to rebound. These are the more fortunate homeowners who merely wish to change homes or relocate to another city by choice. Others have been forced to sell due to a job loss, relocation, financial hardship, or for medical reasons.
Second, over the next 15 to 20 years, millions of aging baby boomers will sell their homes as they opt for condos, retirement communities, or move in with their adult children. While this trend is not likely to cause any noticeable impairment in the housing market in any given year, over time it could cause a large inventory buildup if builders do not adequately account for this long-term trend.
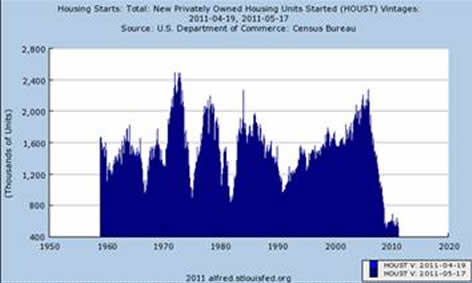
We have already seen how home builders have failed to see the full severity of the real estate collapse, as they were late in halting new home starts.
The remainder of this analysis can be found on our website, www.avaresearch.com.
If you were in the market and did not trim your positions in May in advance of this market correction, YOU ARE BEHIND THE CURVE.
If you want to move ahead of the curve, subscribe to one of our newsletters while the promotional rates are still around. www.avaresearch.com


By Mike Stathis
www.avaresearch.com
Copyright © 2011. All Rights Reserved. Mike Stathis.
Mike Stathis is the Managing Principal of Apex Venture Advisors , a business and investment intelligence firm serving the needs of venture firms, corporations and hedge funds on a variety of projects. Mike's work in the private markets includes valuation analysis, deal structuring, and business strategy. In the public markets he has assisted hedge funds with investment strategy, valuation analysis, market forecasting, risk management, and distressed securities analysis. Prior to Apex Advisors, Mike worked at UBS and Bear Stearns, focusing on asset management and merchant banking.
The accuracy of his predictions and insights detailed in the 2006 release of America's Financial Apocalypse and Cashing in on the Real Estate Bubble have positioned him as one of America's most insightful and creative financial minds. These books serve as proof that he remains well ahead of the curve, as he continues to position his clients with a unique competitive advantage. His first book, The Startup Company Bible for Entrepreneurs has become required reading for high-tech entrepreneurs, and is used in several business schools as a required text for completion of the MBA program.
READ THIS LEGAL NOTIFICATION IF YOU INTEND TO REPUBLISH ANY PORTION OF THIS MATERIAL
Market Oracle has received permission rights to publish this article. Any republications of this article or any others by AVA Investment Analytics must be approved by authorized staff at AVA Investment Analytics. Failure to do so could result in legal actions due to copyright infringement.
Our attorneys have determined that the so-called “Fair Use” exemption as it applies to the Digital Millennium Copyright Act does not permit use by websites that have ads or any other commercial application.
In addition, fair use does not imply articles can be republished or reproduced. The distinction between fair use and infringement may be unclear and not easily defined. There is no specific number of words, lines, or notes that may safely be taken without permission. Acknowledging the source of the copyrighted material does not substitute for obtaining permission. Please see this statement from the U.S. Copyright office for more information. http://www.copyright.gov/fls/fl102.html
Requests to the Publisher for permission or further information should be sent to info@apexva.com
Books Published
"America's Financial Apocalypse" (Condensed Version) http://www.amazon.com/...
"Cashing in on the Real Estate Bubble" http://www.amazon.com/...
"The Startup Company Bible for Entrepreneurs" http://www.amazon.com...
Disclaimer: All investment commentaries and recommendations herein have been presented for educational purposes, are generic and not meant to serve as individual investment advice, and should not be taken as such. Readers should consult their registered financial representative to determine the suitability of all investment strategies discussed. Without a consideration of each investor's financial profile. The investment strategies herein do not apply to 401(k), IRA or any other tax-deferred retirement accounts due to the limitations of these investment vehicles.
© 2005-2022 http://www.MarketOracle.co.uk - The Market Oracle is a FREE Daily Financial Markets Analysis & Forecasting online publication.


