Will Gold Stock Investors Strike Gold?
Commodities / Gold & Silver Stocks Jun 19, 2011 - 06:17 PM GMTBy: Frank_Holmes
 Gold prices passed the $1,500 per ounce mark for the first time ever in mid-April of this year and have set up shop around $1,525-$1,550 an ounce aside from a couple of short pullbacks in early May. So far in 2011, it’s been relatively status quo for those investors who’ve embraced gold as a way to protect themselves from currency debasement, excessive money printing and inflation as prices have increased 7.67 percent. BofA-Merrill Lynch (BofA-ML) analysts are forecasting gold prices could fall to $1,400 an ounce during seasonal weakness in July before rebounding as high as $1,650 an ounce by early fall.
While the party continues for gold bullion prices, stocks of gold companies have been a no-show. The NYSE Arca Gold Bugs Index (HUI) has fallen more than 13 percent year-to-date and the Philadelphia Gold & Silver Index (XAU) has toppled more than 16 percent. Companies such as High River Gold Mines, Jaguar Mining and NovaGold Resources are off more than 45 percent from 2007-2008 highs.
This underperformance has been exacerbated in recent weeks making it a hot topic of discussion among investors, analysts and portfolio managers. This chart shows gold equities of all market capitalization sizes were holding up quite well until late April. That’s when global sentiment toward equities, not just gold shares, began to waver and prices dropped off a cliff.
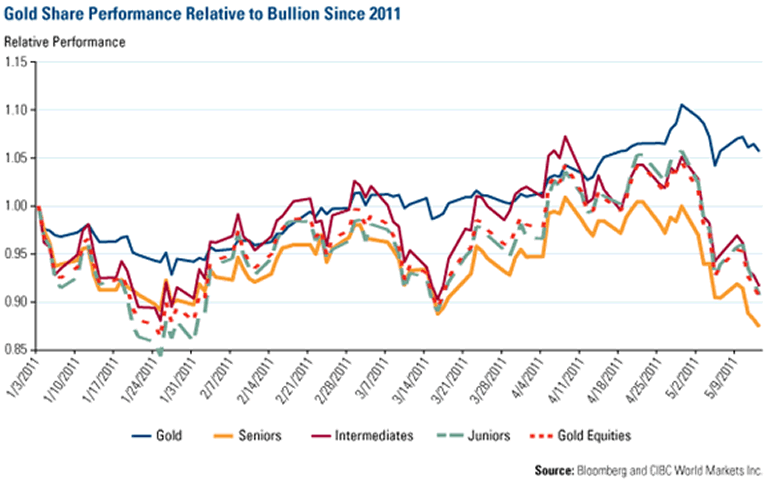
For the purposes of this chart, CIBC qualifies seniors as companies with market capitalizations above $10 billion, intermediates as those between $10 billion and $2 billion, and juniors as those below $2 billion. Non-producing companies are excluded.
Now, short-term aberrations in markets are common, and this isn’t the first time gold bullion and gold equity prices have diverged. Gold equities underperformed gold bullion in 2000 and 2008 during times of extreme market negativity and uncertainty. These previous instances have been merely temporary setbacks and markets generally reverted back to their long-term trends. According to J.P. Morgan research, gold equities have climbed an astounding 1,400 percent off of their 2000 lows while the S&P 500 Index has seen an 11 percent decline.
Here’s the same chart from above but it has been extended out to the beginning of 2009. You can see that with the exception of the seniors, gold equities have far outpaced gold bullion performance by more than 2-to-1.
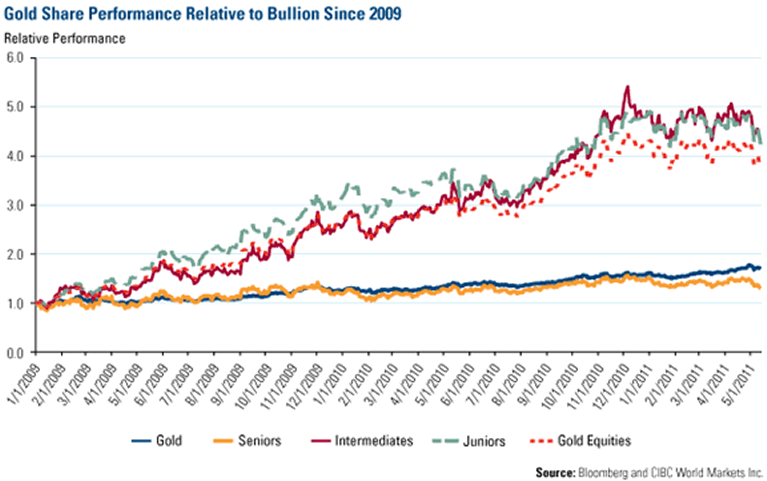
Gold stocks have historically outperformed the gold price by roughly a 3-to-1 ratio. This means that a 5 percent rise in the price of gold generally translated into a 15 percent rise in the miners. Recently, this leverage has eroded to about a 1-to-1 ratio, or lower at times, according to BofA-ML.
Leverage, of course, can work in both directions, and the beta-to-bullion ratio for many gold stocks is stronger during downward price movements and weaker during the upward ones. This means that the gold stocks are being punished for any downside volatility in gold prices, without being rewarded for any increases.
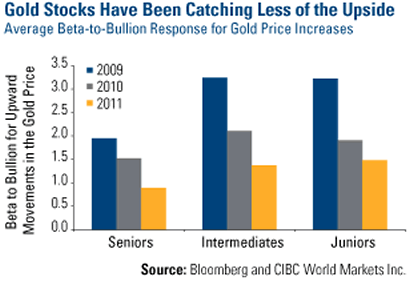
This has been unilateral across different market cap sizes. This chart shows the average beta-to-bullion response for upward movements in the gold price has been declining since 2009. Senior gold stocks have seen the largest decline with their average beta dropping nearly 60 percent.
One likely reason for the loss in upward leverage has been the maturation of the gold investing market. In the past, investors looking to gain gold exposure without the headaches of taking physical possession of gold bullion turned to gold equities. Today, the proliferation of bullion-backed ETFs and the birth of small, gold bar buying programs in Asia have unlocked additional options.
I had lunch with CIBC’s Barry Cooper, gold-company wizard and one of the industry’s best analysts, last week. He sees this recent phenomenon as “a market-sentiment driven event that will pass as fundamental financial drivers kick in to support share prices and drive them higher.” However, the trend could continue as long as the cost of mining operations continues to inflate. Cooper modeled a case study that showed equities can produce an inferior return relative to bullion when the price of an ounce and the cost to produce it rise in tandem despite the opportunity for companies to use higher prices to expand production or increase reserves.
According to Cooper, “the average global cost per ton has been rising at a rate that is slower than the gold prices increase; however, it has also been accompanied by a declining grade profile for most operations.” The average grade of a gold deposit has declined 21 percent since 2005 but higher bullion prices have made it economically viable for gold companies to pursue higher cost projects and keep lower cost, high grade operations off line in case gold prices pull back.
Further, Cooper says this means that “the market seems to have penalized companies for the rising costs associated with lengthening the life of a mine operation…the market does not seem to be paying for the optionality offered by increasing reserves when they come with increased costs.”
The strongest periods of underperformance seem to correspond with times when cost inflation was high. Cooper concluded that “investors seeking gold exposure also want safety in terms of cost containment, and when part of the reason for buying stocks falters, the choice is abandoned for alternative investments.”
BofA-ML estimates that the average all-in cost for the industry was up 19 percent from the previous year to $1,081 an ounce during the first quarter of 2011. The increase is largely due to rising fuel prices, higher labor costs, increased regulatory expenses and declining ore grades.
While it’s true that these rising costs are putting a strain on miners’ profitability, it’s important to keep it in context. While cash costs have increased 19 percent, profit margins—the true gauge of a company’s value—have expanded 25 percent on average, more than offsetting the cost increases.
In fact, financials for the majority of gold companies have been improving for years. According to Cooper, many gold companies “have been generating positive [cash flow] and growing earnings on a per-share basis.” Although it hasn’t showed up in share price performance, senior gold miners have seen the strongest gains with average per share earnings increasing roughly 67 percent since 2009.
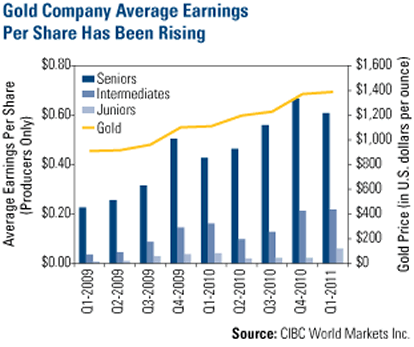
Corporate cash flows for gold producing companies have also increased significantly. The average senior gold miner now has more than twice the amount of cash flow; mid-sized intermediate gold companies’ cash flow has more than tripled.
This year’s carnage has created a substantial opportunity to buy healthy, gold mining companies at historically low prices compared to gold bullion. Cooper says that “the net result is that gold companies can now be purchased for about their intrinsic value for the spot price of bullion.”
Historically, one could purchase about 4.4. units of the XAU for the price of an ounce of gold. That ratio fell to less than 3 units per ounce in the mid-1990s when gold prices bottomed but has averaged 5.2 units during the current bull market.
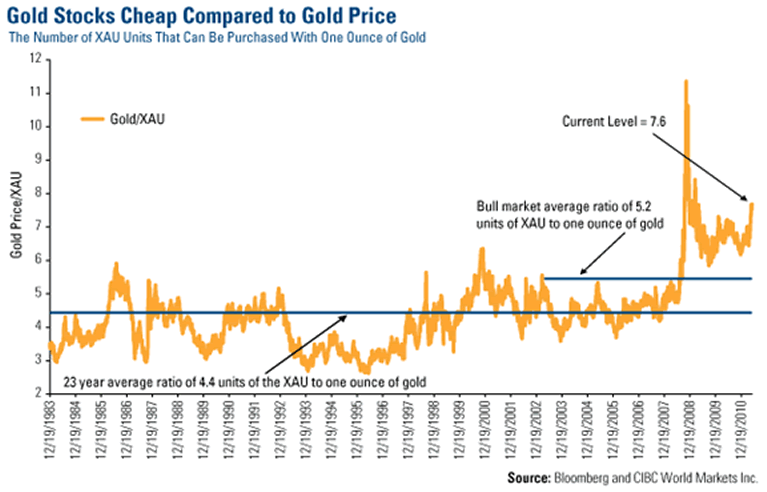
You can see from the chart that today’s level is 46 percent above the historical norm at 7.6 units to one ounce of gold. By this measure, one can purchase shares of gold mining companies at their second-cheapest level in nearly 30 years. The extreme was in 2008 during the depths of the financial crisis; many share values quadrupled off of those levels.
One way gold companies can lure investors is by sharing their profits through dividends. This would provide a cash incentive to hold shares of the company and allow investors to participate in rising earnings. We like the idea of investors getting “paid to wait” or reinvesting those dividends and purchasing additional shares at potentially lower prices.
Newmont Mining, a company whose share price is about 15 percent off of its highs, recently initiated a dividend program and has a current yield of 1.55 percent. Companies such as Buenaventura (1.82 percent), Yamana Gold (1.59 percent), Gold Fields (1.39 percent) and Barrick Gold (1.11 percent) also offer attractive yields.
This week’s events in Greece should remind everyone that global markets are still recovering from 2008’s trauma. The system is not nearly as strained as it was then but we are by no means out of the woods in terms of global economic stability. This should continue to provide a catalyst for strong gold prices.
With gold companies currently undervalued and offering strong cash flows and attractive yields, we think gold equities will be rewarded by the market and rise with strong gold prices. BMO Financial analyst Don Coxe echoes our sentiment: “gold and gold stocks offer a protection that is going to become more valuable in the period of months ahead. It’s possible that the long-awaited period, when gold stocks outperform bullion, is coming soon.”
Ralph Aldis, co-manager of the U.S. Global Investors World Precious Minerals Fund (UNWPX) and Gold & Precious Metals Fund (USERX) contributed to this commentary.
Want to receive commentary from Frank and analysis from the rest of the U.S. Global Investors team delivered to your inbox every Friday? Sign up to receive our weekly Investor Alert at www.usfunds.com.
U.S. Global Investors, Inc. is an investment management firm specializing in gold, natural resources, emerging markets and global infrastructure opportunities around the world. The company, headquartered in San Antonio, Texas, manages 13 no-load mutual funds in the U.S. Global Investors fund family, as well as funds for international clients.
Holdings in the World Precious Minerals Fund and Gold & Precious Metals Fund as of March 31, 2011:
High River Gold Mines: 0.00%
NovaGold Resources: 0.00%
Jaguar Mining: 0.00%
Newmont Mining: Gold & Precious Metals Fund 0.75%
Buenaventura: 0.00%
Barrick Gold: Gold & Precious Metals Fund 7.17%, World Precious Minerals Fund 2.82%
Yamana Gold: Gold & Precious Metals Fund 3.76%, World Precious Minerals Fund 2.93%
Gold Fields: Gold & Precious Metals Fund 0.64%
The NYSE Arca Gold BUGS (Basket of Unhedged Gold Stocks) Index (HUI) is a modified equal dollar weighted index of companies involved in gold mining. The HUI Index was designed to provide significant exposure to near term movements in gold prices by including companies that do not hedge their gold production beyond 1.5 years. The Philadelphia Stock Exchange Gold and Silver Index (XAU) is a capitalization-weighted index that includes the leading companies involved in the mining of gold and silver. Beta is a measure of the volatility, or systematic risk, of a security or a portfolio in comparison to the market as a whole.
For more updates on global investing from Frank and the rest of the U.S. Global Investors team, follow us on Twitter at www.twitter.com/USFunds or like us on Facebook at www.facebook.com/USFunds. You can also watch exclusive videos on what our research overseas has turned up on our YouTube channel at www.youtube.com/USFunds.
Please consider carefully the fund's investment objectives, risks, charges and expenses. For this and other important information, obtain a fund prospectus by visiting www.usfunds.com or by calling 1-800-US-FUNDS (1-800-873-8637). Read it carefully before investing. Distributed by U.S. Global Brokerage, Inc.
Standard deviation is a measure of the dispersion of a set of data from its mean. The more spread apart the data, the higher the deviation. Standard deviation is also known as historical volatility. All opinions expressed and data provided are subject to change without notice. Some of these opinions may not be appropriate to every investor. The S&P 500 Stock Index is a widely recognized capitalization-weighted index of 500 common stock prices in U.S. companies. The NYSE Arca Gold BUGS (Basket of Unhedged Gold Stocks) Index (HUI) is a modified equal dollar weighted index of companies involved in gold mining. The HUI Index was designed to provide significant exposure to near term movements in gold prices by including companies that do not hedge their gold production beyond 1.5 years. The MSCI Emerging Markets Index is a free float-adjusted market capitalization index that is designed to measure equity market performance in the global emerging markets. The U.S. Trade Weighted Dollar Index provides a general indication of the international value of the U.S. dollar.
Frank Holmes Archive |
© 2005-2022 http://www.MarketOracle.co.uk - The Market Oracle is a FREE Daily Financial Markets Analysis & Forecasting online publication.


