Market Analysis - Stocks, Bonds & Commodities
Stock-Markets / Forecasts & Technical Analysis Jan 31, 2007 - 09:09 AM GMTBy: Douglas_V_Gnazzo
Economy
The Commerce Department reported sales of new homes were up 4.8% to an annual pace of 1.12 million units. New orders for durable goods gained 3.1%. Durable goods for non-defense capital goods, excluding aircraft, was up 2.4%. Spending on equipment and software increased at an annual rate of 7.7% in the third quarter, after a 1.4% decrease in the prior quarter. Orders for commercial aircraft increased 27% after rising 3.8% in November. Orders excluding military equipment rose 3.9% last month.
The economy expanded at a 2% annual pace in the third quarter, the slowest rate so far reported. Motor vehicle and parts bookings jumped 6.8% in December - not an insignificant amount. Orders for machinery rose 5%, largely attributed to an increased demand for communications equipment. Existing Homes sales for 2006 were down 8.4% from 2005 levels of 6.648 million. And while 2006 was the weakest year of sales since 2003's 6.175 million, keep in mind that existing home sales averaged 3.99 million units annually during the nineties.
For the year, New Home Sales dropped 17.3% from record 2005 levels, to the lowest sales since 2003. For comparison, sales averaged 698,300 during the nineties.
Stocks
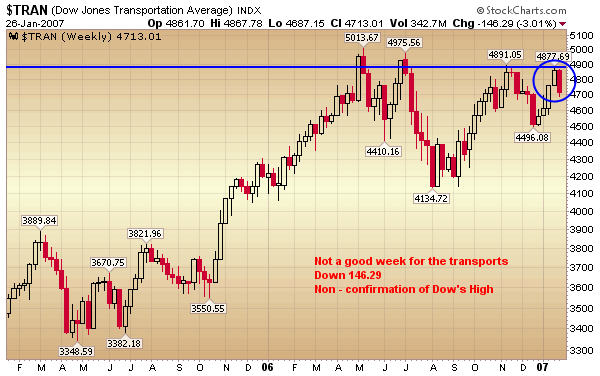
U.S. stocks chalked up the worst week this year, after the above government reports on housing and manufacturing growth raised the odds that the Federal Reserve won't cut interest rates in the near future. The Dow and S&P 500 both gained 0.6%. The Utilities were up 0.5%. The Transports lost a significant 3.0%. The NASDAQ 100 was down 1.3%.
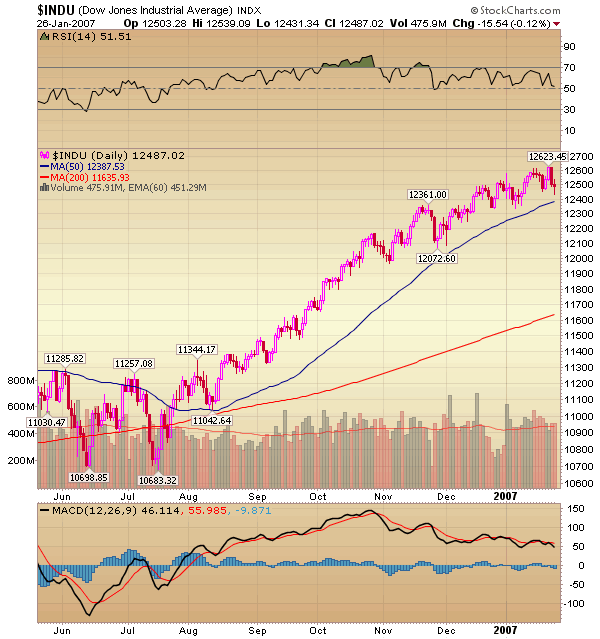
Canadian stocks had their biggest weekly gain in two months, as energy producers including Suncor advanced on higher crude oil prices and takeover speculation. The chart below shows the Dow ascending from the bottom left hand corner of the chart - upwards to the right hand corner of the chart: a bullish signature with higher highs and higher lows.
Of concern, however, are the RSI and MACD indicators. RSI peaked just below the 70 level and has been steadily declining with the 50 level coming up quickly (51.51 presently). The RSI indicator also shows a negative divergence from the Dow, which made a series of new highs while RSI was making lower highs. MACD indicates the same negative divergence. MACD also shows a negative cross over headed downwards.
Caution is warranted for the Dow at the present time. A fairly significant correction may be looming on the horizon. If the 50 ma is breached to the downside - look for a fall towards the 200 ma.
Bonds & Rates
Those familiar with our report know that we have continually stressed the importance of interest rates in the present market environment. Interest rates are basically the cost of money - at least of borrowing money, which has unfortunately, become a national pastime. The Fed has been inclined towards an inverted yield curve (short term rates higher than long term rates), which they have been successful at obtaining. We have always said that such was their goal, but that it may prove difficult to maintain for any significant amount of time; as the market dictates long term rates - not the Fed.
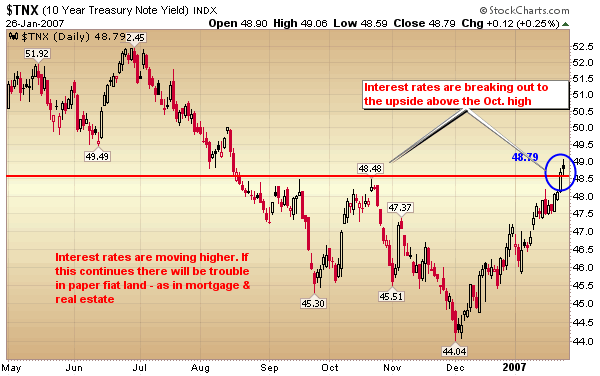
Now, long term rates are on the rise and have broken above their highs from October and even back to August. If the present action continues it will result in a very bad trend for the bond market, the mortgage market, the housing market, and the stock market as well. Needless to say it warrants watching.
The chart below shows the 10 Year Note Yield breaking out to new highs, which if it continues will be tough on those with variable rate mortgages - of which there are a few around. This would just be the first market deleteriously affected. The derivatives markets, especially the interest rate derivatives - could experience declines of more than 3 standard deviations - for which they were not created to handle. Uncharted waters without a paddle.
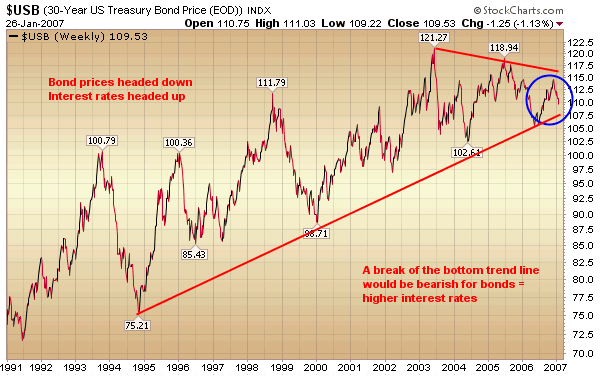
The next chart below shows the 30 Year Bond Price (not yield or interest rate). The price of bonds moves inversely (opposite) to its yield or interest rate. If bond prices are rising, then interest rates are falling. If bond prices are falling, then interest rates are rising.
A trend of falling interest rates denotes a bull market in bond prices. A rising trend of interest rates denotes a bear market in bond prices.
Long term interest rates have reversed their bullish falling trend. Existing rising rates may just be a correction of a long term bull market in bond prices, or it may be the start of a new trend. Pay close attention to the direction of interest rates, as many markets are connected to them at the hip. Whichever way rates go - they go.
Mortgage rates and the housing market are the most sensitive to a rise in interest rates. A rising rate TREND would be a disaster for both the mortgage market and the real estate market.
Two year yields were up 5.5 bps to 4.97%. Five year yields increased a significant 8.5 bps to 4.87%. 10 year yields rose 10 bps to 4.87%. Long bond yields exploded up 11 bps to 4.97%. The spread between the 2 year and 10 year closed the week inverted 10 bps. Interest rates in our market have to remain competitive with other foreign bond yields in order to attract the huge amount of money needed to sustain our fragile and debt dependent economy. Just to service the debt (pay the interest) is a Sisyphean task.
Axel Weber of the European Central Bank Council (ECB) said the bank must continue raising interest rates to fight rising inflation, supposedly due to the fastest economic growth rates in the last six years. As head of Germany's Bundesbank he said, "We have to take this process of withdrawing monetary stimulation further."
I wonder why our central bankers at the Fed never thought of that? Or worse yet - perhaps they did, but chose to ignore it.
The ECB uses M3 money supply growth as a gauge of future inflation. It expanded 9.7% in December, contributing to the consensus view of future rate hikes to come. It raised interest rates for the sixth time to 3.5% back in December, and investors expect another increase to 3.75% before Spring.
Data that the pace of inflation in the euro region is accelerating is causing speculation that the European Central Bank will stay to the course of rising interest rates. European bonds declined accordingly. German 10 year bond yields gained 4 bps to 4.09%.
US Treasuries are sporting the highest rates since August, and have broken out to the upside as the charts illustrate.
Emerging market bonds fell - meaning that interest rates went up, on the concern that economic strength in the US might cause the Federal Reserve to raise interest rates on US Treasuries. This would cause emerging market, or riskier debt obligations, to raise rates to entice buyers to accept, and be compensated for - the additional risk as compared to US Treasuries.
Japan's 10 year bonds declined on speculation that yields are about as low as they are going to go, unless the Bank of Japan returns to its zero interest rate policy (which I would not count out of the question). The yield on the 10 year bond climbed 4 basis points to 1.69% during the past week. Speculators say that the 10 year could climb to 1.85% or higher.
Note there seems to be a global trend towards HIGHER rates. Fed Foreign holdings of Treasury Debt rose $6.9 billion last week to a record $1.77 Trillion. Custodial holdings were up $242 billion or 15.8%.
US Dollar & Currencies
The dollar gained against the euro and the yen last week, supposedly due to the rise in durable goods and housing data. The dollar also was up versus the British pound and the Swiss franc. The euro set a record high of 158.62 yen this past week. Living in the land of zero bound interest rates doesn't do wonders for one's currency. The yen has fallen 5.6% against the euro in the past six months; and it has lost 4.3% versus the dollar in the same time frame.
The South African rand dropped 1.7% against the dollar this past week. We note this because it has a POSITIVE affect on South African gold miners whose costs are denominated in the SA Rand, while the price of gold is denominated in US Dollars. International reserve assets, excluding gold, were up $805 billion or 19.5% - setting another record of $4.93 Trillion.
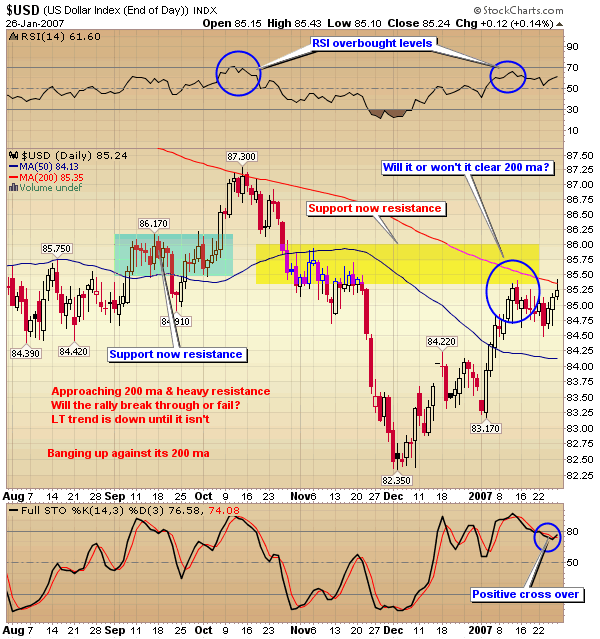
The chart below of the dollar shows it bumping up against its 200 ma and significant overhead resistance. The recent bounce in the dollar is just that - a bounce or counter trend rally within a long term bear market. The dollar should soon start to realign itself with the long term trend, which is down.
Commodities & Energy
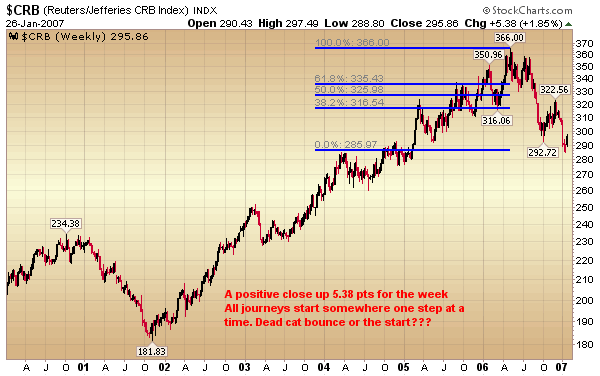
For the week, the CRB index gained 1.9%. Nickel was up 5.5% and has more than doubled in the past year. Copper gained 3.8% and aluminum rose $3 to $2,795 a ton. Lead, tin, and zinc were down for the week, as were wheat prices. Natural gas was up 0.27 cents or 4.2%, due to forecasts showing below average temperatures across the eastern half of the U.S. that are expected to continue for the next two weeks.
The Energy Department's weekly data on NG supplies reported a decline of 179 billion cubic feet, the largest decline of the winter thus far. Stockpiles still remain 21% higher than the 5 year average.
Oil
Crude prices were up to the highest in more than two weeks. Colder weather has crept over much of the U.S. increasing heating fuel demand. OPEC is also talking about further cuts in supplies. Crude oil closed up $1.19 to $55.42 a barrel on the New York Mercantile Exchange. However, prices are still down 10% in the past year.
The Energy Department reported that U.S. inventories of distillate fuel were 9.4% above their five year average. Crude oil and gasoline stockpiles were also above their five year average. BP Plc, Europe's second largest oil company, may be considering a takeover of Suncor, the world's second biggest oil-sands producer.

Gold
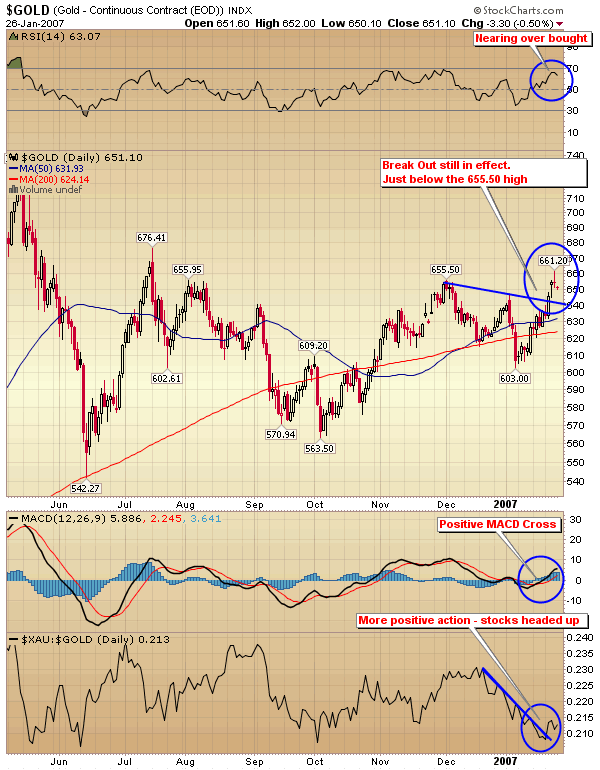
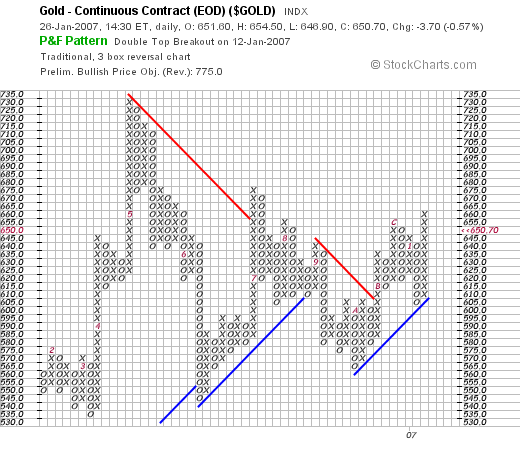
Gold had a good week moving up $14.30 to $650.70 for a gain of 2.25%. It was the highest weekly close since July 14, 2006. There are many positive indicators on the chart. MACD has had a positive cross over and RSI is approaching the strong 70 level. The break out is still in place and the next target is the December high of $655.50. A breach of this price level would be very bullish if it holds for a two day and weekly close. Then the July high of $676.41 would come on the radar screen.
The XAU/GOLD ratio has also broken above its upper trend line, which indicates that the stocks are starting to act better then the metal. The PM stocks go up when they foresee higher prices coming in the metal. Time will tell.
Silver
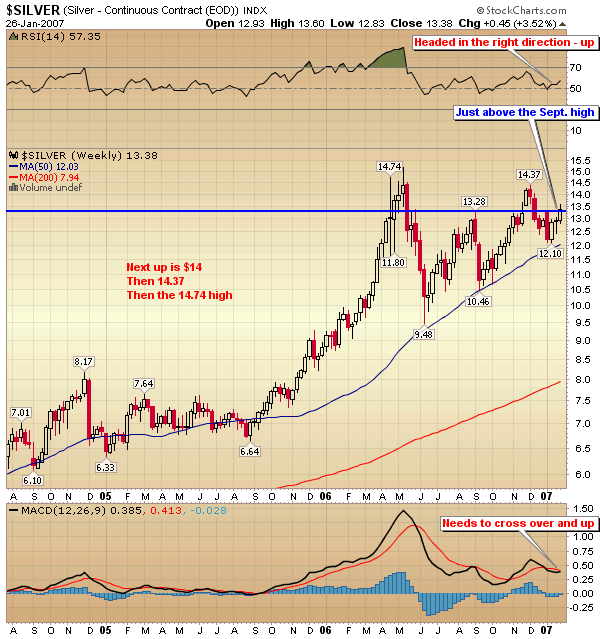
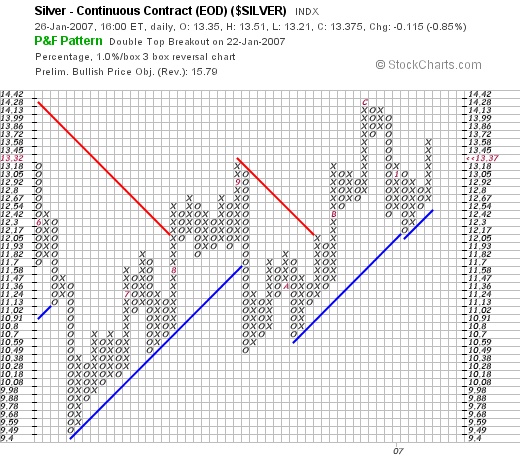
Silver also had a good week - up 0.45 cents to close at $13.38 for a gain of 3.52%. It was silver's highest weekly close since December 8, 2006. Silver has broken above the September high of $13.28. Its next target is the December high of $14.37, which is a significant move that will not occur all at once. There is still plenty of overhead supply that needs to be worked off.
HUI Index
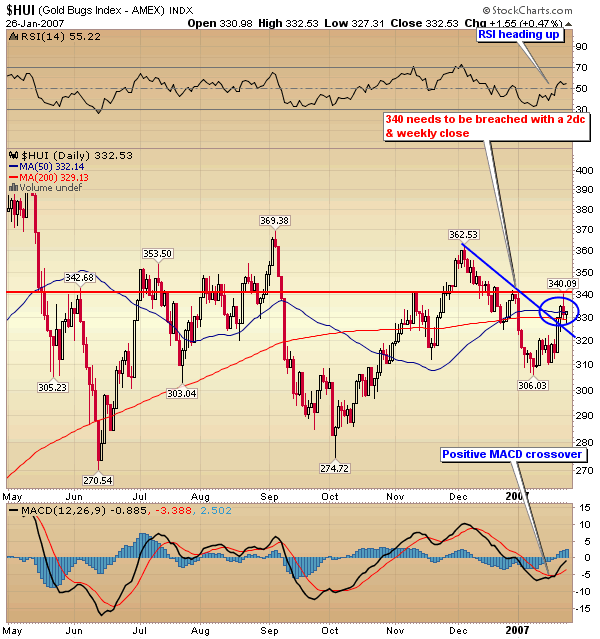
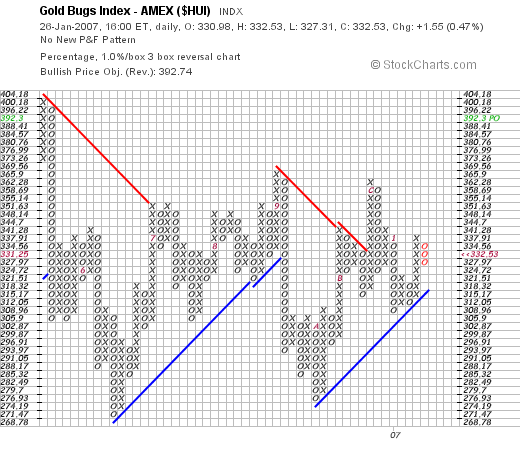
The HUI Index had an excellent week - gaining 14.25 to close at 332.53 for a gain of 4.48%. The index handily out performed physical gold. It now needs to clear the important 340.09 level. There is significant overhead resistance from 340-350 that is going to take so time to work off. MACD has recently registered a positive cross over. Things are looking good - but there is still much work to be done.
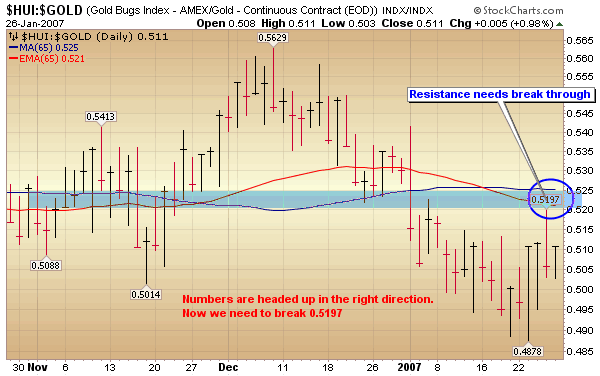
HUI/GOLD RATIO
The hui/gold ratio has started to turn up, meaning the stocks are out performing the metal. There is significant resistance just above and a break above 0.525 would be very bullish. Once again this is probably not going to happen overnight but will require some work and perseverance: something that gold has been good at for well over 5000 years.
Point & Figure Charts
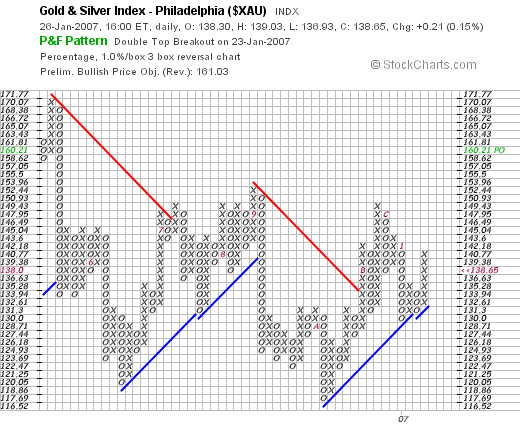
Next up is a point & figure chart for gold, followed by one for silver and one for the HUI & XAU Indexes. The gold, silver and XAU charts are traditional 3 box reversal charts, while the HUI Index chart is a percentage chart using a three box reversal. The latter is more sensitive to short term changes then the former. All four charts show a bullish price projective for gold, silver, and the respective indexes. However, a traditional p&f chart of the hui still shows a bearish price objective. Caveat Emptor.
Gold & Silver Stocks
Next we are going to look at three gold stocks and one silver stock. Please note that we own a considerable amount of shares in each of the four stocks. They are listed on the website in our gold stock portfolio. Right or wrong we put our money where our mouth is. We buy and sell all the stocks we mention. Talk is cheap - it only costs the other guy money - not the one doing the yapping. It's easy to tell other people how to invest their money. It's totally different to invest your own money in what you say are supposedly good investments. If its good enough for the other guy - it sure as hell ought to be good enough for oneself.
Silver Wheaton
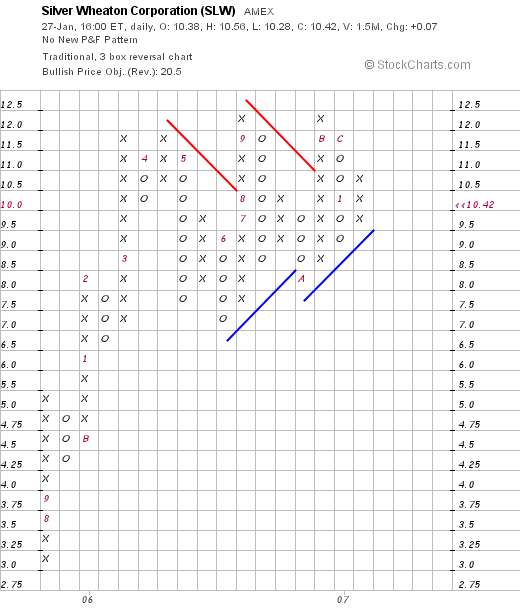
First up is Silver Wheaton. The chart speaks for itself. Its bullish price objective is 20.50. It's not going to just go straight up to that level - it might not even get there, but it is a bullish chart formation.
Gold Fields
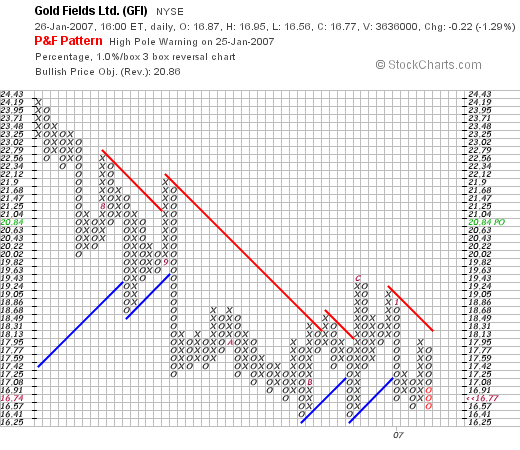
Next up is Gold Fields, one of the worlds top shelf miners. It's presently making a bid to buy out Bema Gold, which is somewhat weighing down on its short term price performance. However, the acquisition is a good investment for GFI and represents significant long term value. It will provide GFI with more known proven reserves, which it has the capability of bringing up above ground and on line. Bema does not. A reasonable, fair, and equitable price is being offered.
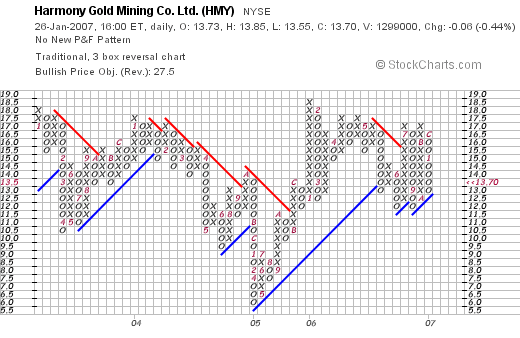
Harmony Gold
Harmony like Gold Fields is located in South Africa. It is another one of the premier gold mines in the world. It has good production rates and significant known and proven reserves. The chart speaks for itself - projecting a doubling in price. We will be glad to take half of that.
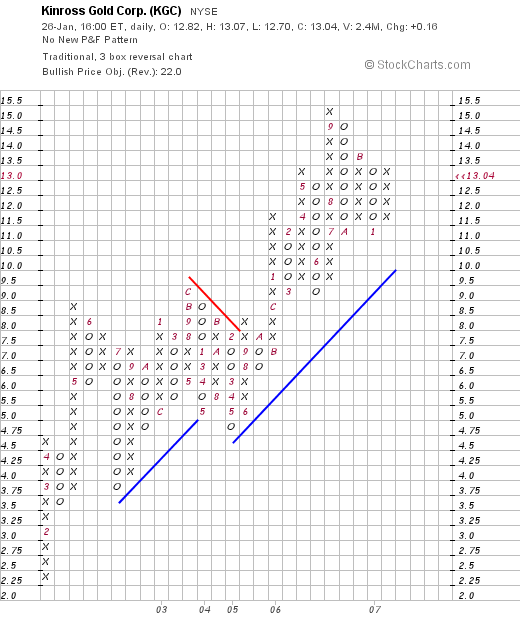
Kinross Gold
Kinross is located in North America, which means it has less geopolitical risk compared to the South African miners. Canada is a bit more stable then is South Africa.Kinross is a major player, with good production levels and significant known and proven gold reserves. It has been performing quite well of late.Its projected price objective is $22 and it presently is at $13.04. The projected price may never be reached, and it is not going to happen overnight. We are in no hurry - we will gladly except half that increase in due time.
Summary
Interest rates and debt levels are keys to the financial, monetary, and economic markets of the world. If interest rates embark on a rising trend there will be trouble in paper fiat land. If such occurs, the only investments that will do well will be gold and silver.
Why? - because they are real assets - not paper i.o.u's - they are outside of the established investment system. They are not anyone's obligations.
They cannot be controlled by the bankers, which is why they fear and hate them. Gold and silver keeps them honest as good little boys and girls. No fooling the teacher.
Stock markets have been on a tear. They have appreciated significantly. We would take the money and run, and wait for them to correct back down to more reasonable levels of valuation.
Bonds APPEAR to be entering a bear market. If so, this is not going to be a pretty sight: not just for bonds, but for many other markets as well: mortgages, real estate, stocks, and bonds themselves. There will also be nasty repercussions in the derivative markets.
Interest rates derivatives are the largest single market there is. The carry trades will also be affected. We do not know for sure if this is or is not going to occur. But if it does expect the unexpected and be prepared. As we have said - it will not be pretty. Hopefully, however, we are wrong and it does not come to pass.
Currencies are pretty much all in the same boat, as they are all paper fiat debt-obligations. However, some are in worse shape then others due to being farther along in their self-destructive inflationary cycle. It is a game of worldwide currency devaluation.
Of the major world currencies the US Dollar is the weakest, as it has been debased the most, causing it to loose 95% of its purchasing power. It is an accident waiting for a time and place to happen - to either explode or implode: by hyperinflation or deflation respectively.
It is even quite probable to get one of the flations followed by the other. Very nasty business if it occurs. Once again, hopefully we are wrong. However, forewarned is forearmed.
The geopolitical front around the world is dominated and dictated by the United States. We have troops spread out across the globe. The hot spots that make the news are Iraq, Afghanistan, Dafur, Somalia, Iran, and Israel & Lebanon.
These are just a few of the locations on earth that the U.S. is involved in ACTIVE MILITARY COMBAT, attempting to resolve its way of government and beliefs upon others deemed to be less fortunate and less in the know.
There are even more areas where we are working by non-military means to affect the same geopolitical and social change. Molding the world to one's vision is a great task. One that might not be capable of fruition from the outside in. There are lessons to be learned in all things. So it will be.
It should be remembered that we do have choices. We can choose to walk down the path of life we so desire. Some paths are harder than others. Sometimes we pick the harder path because it appears to be the path of least resistance. Perceptions can be deceiving.
But that doesn't always mean it is the best - or less painful road to travel. The other path may take more effort - but the way may be more self-rewarding. Whatever is self-rewarding, is also of great value and help to others.
There are decisions being made by world leaders that should be looked at very closely - searched over with a fine toothed comb, looking for any defects. When you send your child to school you do not tell him to beat up all the other kids at recess to preemptively establish his self-security or safety. Such would be ludicrous, while choosing the left hand path.
When our children come to us for advice because of complications or difficulties in interacting with others, we do not tell them to simply impress their way upon those on the other side of the issue - to control the situation by force of will power over others.
Such would be extremely unhealthy behavior - resulting in self-defeating consequences down the road, for perhaps the rest of one's life. What is bad for the individual is bad for the group.
Perhaps we should follow our own advice we give to our children. Perhaps we should return the golden - to the practice of the golden rule. How easy it is to forget. How sad are the consequences - not only for others, but for ourselves as well. The world is what we make it - or what we allow others to make it in spite of ourselves. Vote accordingly.
See the market indicator below. Good luck. Good trading. Good health. And that's a wrap.
Market Indicator Outlook
| Market | Short-Term (0-3 Month) |
Intermediate-Term (3-12 Month) |
Long-Term (1-5 Year) |
| Gold | Bullish | Bullish | BULLISH |
| Silver | Bullish | Bullish | BULLISH |
| Natural Gas | Bullish | Bullish | BULLISH |
| Oil - WTIC | Bullish | Bullish | Bullish |
| Gold & Silver Stocks | Bullish | Bullish | BULLISH |
| Commodities CRB Index | Neutral/Bullish | Neutral/Bullish | Bullish |
| Stock Market - S & P 500 | Neutral/Bearish | Neutral | BEARISH |
| Stock Market - NASDAQ | Neutral/Bearish | Neutral | BEARISH |
| US 30 Day T - Bill | Bullish | Bullish | Bullish |
| US 10 Year T - Note | Bearish | Bearish | Bearish |
| US 30 Year T - Bond | Bearish | Bearish | BEARISH |
| US Dollar Index | Neutral/Bearish | Bearish | BEARISH |
| Real Estate/Housing | Bearish | Bearish | BEARISH |
Douglas V. Gnazzo
Honest Money Gold & Silver Report
Douglas V. Gnazzo is the retired CEO of New England Renovation LLC, a historical restoration contractor that specialized in the restoration of older buildings and vintage historic landmarks. Mr. Gnazzo writes for numerous websites, and his work appears both here and abroad. Just recently, he was honored by being chosen as a Foundation Scholar for the Foundation of Monetary Education (FAME). Come visit our new website: Honest Money Gold & Silver Report , And read the Open Letter to Congress
Disclaimer: The contents of this article represent the opinions of Douglas V. Gnazzo. Nothing contained herein is intended as investment advice or recommendations for specific investment decisions, and you should not rely on it as such. Douglas V. Gnazzo is not a registered investment advisor. Information and analysis above are derived from sources and using methods believed to be reliable, but Douglas. V. Gnazzo cannot accept responsibility for any trading losses you may incur as a result of your reliance on this analysis and will not be held liable for the consequence of reliance upon any opinion or statement contained herein or any omission. Individuals should consult with their broker and personal financial advisors before engaging in any trading activities. Do your own due diligence regarding personal investment decisions. This article may contain information that is confidential and/or protected by law. The purpose of this article is intended to be used as an educational discussion of the issues involved. Douglas V. Gnazzo is not a lawyer or a legal scholar. Information and analysis derived from the quoted sources are believed to be reliable and are offered in good faith. Only a highly trained and certified and registered legal professional should be regarded as an authority on the issues involved; and all those seeking such an authoritative opinion should do their own due diligence and seek out the advice of a legal professional. Lastly, Douglas V. Gnazzo believes that The United States of America is the greatest country on Earth, but that it can yet become greater. This article is written to help facilitate that greater becoming. God Bless America.
© 2005-2022 http://www.MarketOracle.co.uk - The Market Oracle is a FREE Daily Financial Markets Analysis & Forecasting online publication.


