Peak Oil – The Long & The Short
Commodities / Crude Oil Jun 15, 2011 - 01:35 PM GMTBy: James_Quinn
 Does it seem like we’ve been here before?
A barrel of Brent Crude (the truest indicator of worldwide oil scarcity) sits at $118, up from $75 per barrel in July 2010 – a 57% increase in eleven months. In the U.S., the average price of gasoline is $3.69 per gallon this week, up 37% in the last year and up 100% in the last 30 months.
The pundits and politicians are responding predictably. They blame the Libyan revolution, the dreaded speculators and that old fallback – Big Oil. When the Middle East turmoil began in earnest in January, gas prices had already risen 15% in three months, spurred by increased worldwide demand and by Ben Bernanke’s printing press. Congressmen have reacted in their usual kneejerk politically motivated fashion by demanding that supplies be released from the Strategic Oil Reserve.
Congress has a little trouble with the concept of “strategic.” They also have difficulty dealing with a reality that has been staring them in the face for decades. Politicians will always disregard prudent, long-term planning for vote-generating talk and gestures.
The Long Term
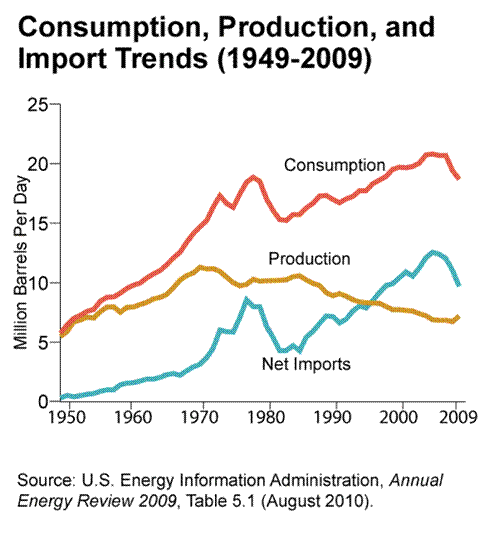
Peak oil has been a mathematically predictable occurrence since American geophysicist M. King Hubbert figured out the process in 1956. His model predicted that oil production in the United States would peak in 1970. He wasn’t far off. In 1971, when the U.S. was producing 88% of its oil needs, domestic production approached 10 million barrels per day and has been in decline ever since.

(Source: http://www.eia.doe.gov/energy_in_brief/images/charts/
Consumption_production_import_trends-large.gif)
The Department of Energy was established in 1977 with a mandate to lessen our dependence on foreign oil. At the time, the U.S. was importing 6.5 million barrels per day. In 1985 the country was still able to produce enough to cover 75% of its needs. Today, 34 years later, the U.S. imports 10 million barrels per day, almost half of what it uses.
President Obama’s 2011 Budget proposal included priorities for the DOE:
- Positions the United States to be the global leader in the new energy economy by developing new ways to produce and use clean and renewable energy.
- Expands the use of clean, renewable energy sources such as solar, wind and geothermal while supporting the Administration’s goal to develop a smart, strong and secure electricity grid.
- Promotes innovation in the renewable energy sectors through the use of expanded loan guarantee authority.
That’s what goes on in talk space.
Back on planet Earth, not a single U.S. oil refinery or nuclear power plant has been built since 1977. Decades of inaction and denial have left our energy infrastructure obsolescent and decaying. Pipelines, tanks, drilling rigs, refineries and tankers have passed their original design lives. The oil industry is manned by an aging workforce of geologists, engineers and refinery hands. Many are nearing retirement, and there are few skilled personnel to replace them.
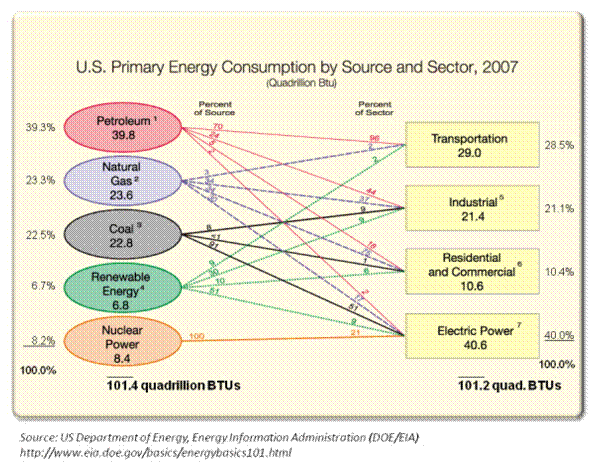
Denial of peak oil becomes more dangerous by the day. The Obama administration prattles about clean energy, solar, wind and ethanol, when petroleum powers 96% of the transportation sector and 44% of the industrial sector. Coal provides 51% of the country’s electricity, and nuclear accounts for another 21%. Renewable energy contributes only 6.7% of the country’s energy needs, mostly from hydroelectric facilities.
Ethanol works nicely as a slogan but poorly as a solution. The ethanol boondoggle diverts 40% of the U.S. corn crop to fuel production. The real cost to produce a gallon of ethanol (tariffs, lost energy, higher food costs) exceeds $7 and has contributed to the price of corn rising 112% in the last year. The 107 million tons of grain that went to U.S. ethanol distilleries in 2009 would have been enough to feed 330 million people for one year.

(Source: http://perotcharts.com/category/challenges/energy/)
The most worrisome aspect of peak oil is that our government leaders have known of it and have chosen to do nothing. The Department of Energy requested a report from widely respected energy expert Robert Hirsch in 2005. The report clearly laid out the dire situation:
The peaking of world oil production presents the U.S. and the world with an unprecedented risk management problem. As peaking is approached, liquid fuel prices and price volatility will increase dramatically, and, without timely mitigation, the economic, social, and political costs will be unprecedented. Viable mitigation options exist on both the supply and demand sides, but to have substantial impact, they must be initiated more than a decade in advance of peaking.
Some of his conclusions:
- World oil peaking is going to happen, and will likely be abrupt. World production of conventional oil will reach a maximum and decline thereafter.
- Oil peaking will adversely affect global economies, particularly the U.S. Over the past century, the U.S. economy has been shaped by the availability of low-cost oil. The economic loss to the United States could be measured on a trillion-dollar scale.
- The problem is liquid fuels for transportation. The lifetimes of transportation equipment are measured in decades. Rapid changeover in transportation equipment is inherently impossible. Motor vehicles, aircraft, trains and ships have no ready alternative to liquid fuels.
- Mitigation efforts will require substantial time. Waiting until production peaks would leave the world with a liquid fuel deficit for 20 years. Initiating a crash program 10 years before peaking leaves a liquid fuels shortfall of a decade. Initiating a crash program 20 years before peaking could avoid a world liquid fuels shortfall.
World liquid oil production has never exceeded the level reached in 2005. It becomes more evident by the day that worldwide production has peaked. Robert Hirsch was correct. The world will have a liquid fuel deficit for decades.
The Short Term
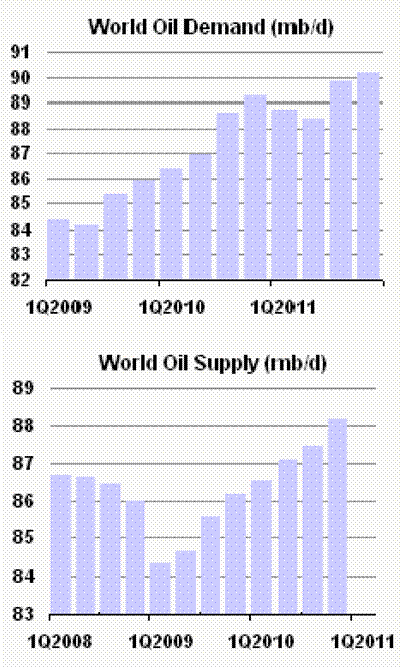
The International Energy Agency has been increasing its estimates for world oil consumption to over 90 million barrels per day by the 4th quarter of 2011, led by strong demand from China, India and the rest of the emerging world. World supply was already straining to keep up with this demand before the recent tumult in the Middle East. The mayhem in Tunisia, Egypt, Libya, Bahrain, Yemen and Iran has already taken 1.5 million barrels per day off the market, according to the IEA.

(Source: http://omrpublic.iea.org/)
The Obama administration and mainstream media continue to downplay the economic impact of the conflagration spreading around the world. The risk that oil prices gush toward the 2008 highs is much greater than the likelihood that this turmoil will subside and oil prices fall back to $80 per barrel. As the following chart shows, the daily oil supply coming from countries already experiencing revolution or in danger of uprisings is nearly 8 million barrels per day, or 9% of world supply. No country can ramp up production to make up for that shortfall.
|
Proven Oil |
Oil |
Country |
Reserves (billion barrels) |
Production Per Day |
Saudi Arabia |
265 |
9,000,000 |
Iran |
137 |
3,700,000 |
Iraq |
115 |
2,700,000 |
UAE |
98 |
2,300,000 |
Kuwait |
102 |
2,300,000 |
Libya |
46 |
1,600,000 |
Algeria |
12 |
1,300,000 |
Qatar |
25 |
820,000 |
Oman |
6 |
810,000 |
Egypt |
4 |
742,000 |
Syria |
3 |
376,000 |
Yemen |
3 |
298,000 |
The Washington DC spin doctors are now assuring the American people that Saudi Arabia can make up for any oil shortfall. Saudi Arabia has declared it has already turned the spigot on and will produce 10.0 million bpd, up from 8.5 million bpd.
Is this replacement production real? A leading industry expert revealed that the Saudis were already producing 8.9 million bpd in January. Hype and misinformation won’t fill your SUV with cheap gas. Saudi production peaked at 9.8 million bpd in 2005. When prices spiked to $147 per barrel in early 2008, their production grew only to 9.5 million bpd. Saudi oil fields are 40 years old and are in terminal decline. Their “spare capacity” doesn’t exist.
And the media ignore the quality difference between Libyan crude and Saudi crude. Libya’s oil is a perfect feedstock for ultra-low-sulfur diesel. The oil Saudi Arabia will supply to replace it is not. It takes three barrels of Saudi crude to yield the same quantity of diesel fuel as one Libyan barrel of crude, and only specially designed refineries can process high-sulfur Saudi oil.
The problem isn’t just turmoil in the Middle East. The Persian Gulf provides 17% of U.S. imports; 22% comes from Africa, 10% from Venezuela and 15% from Mexico. Many of these countries hate us. Mexico, although a relatively friendly country, will become a net importer of oil in the next five years, as its Cantarell oil field is in rapid decline. They’ll have nothing to sell to us.
The long and the short of it is that sunshine, corn and wind will not keep Americans from paying $5 per gallon or more for gas in the near future. The financial implications are that oil and energy investments will produce solid returns over the coming years.
This article was originally published in the Casey Report.
Join me at www.TheBurningPlatform.com to discuss truth and the future of our country.
By James Quinn
James Quinn is a senior director of strategic planning for a major university. James has held financial positions with a retailer, homebuilder and university in his 22-year career. Those positions included treasurer, controller, and head of strategic planning. He is married with three boys and is writing these articles because he cares about their future. He earned a BS in accounting from Drexel University and an MBA from Villanova University. He is a certified public accountant and a certified cash manager.
These articles reflect the personal views of James Quinn. They do not necessarily represent the views of his employer, and are not sponsored or endorsed by his employer.
© 2011 Copyright James Quinn - All Rights Reserved
Disclaimer: The above is a matter of opinion provided for general information purposes only and is not intended as investment advice. Information and analysis above are derived from sources and utilising methods believed to be reliable, but we cannot accept responsibility for any losses you may incur as a result of this analysis. Individuals should consult with their personal financial advisors.
James Quinn Archive |
© 2005-2022 http://www.MarketOracle.co.uk - The Market Oracle is a FREE Daily Financial Markets Analysis & Forecasting online publication.


