Yikes, Was That The Top In The Stock Market ?
Stock-Markets / Stock Markets 2011 Jun 13, 2011 - 05:00 AM GMTBy: Bob_Clark

 My cyclical model says to expect a rally in the stock market soon. We have fallen for six weeks in a row and the media patter is starting to turn bearish.
The question is, if we do rally, is it the end of the decline.
In my last article in April, I said the SPX had one last run to a new high left in it before it would roll over in May. I called it a "getting blood from a stone" trade. In it I predicted the top and the subsequent decline perfectly.
Perfect short
At the time the buzz from the experts was that we had an inverse head and shoulders pattern set up and it projected to at least 1430 on the SPX.
When it comes to using patterns to trade, I take a different view than most traders. In my opinion, if a pattern is obvious, it is because the Fat Boys want it to be seen.
For example, if you remember last summer, the talk was that we had formed, or were in the process of forming a large H&S top. Anytime I see the media jump on the obvious, my trader senses start to tingle. I know that a profitable trade is coming in the opposite direction.
There will be more talk of head and shoulders as time passes, because we seem to be forming one now.
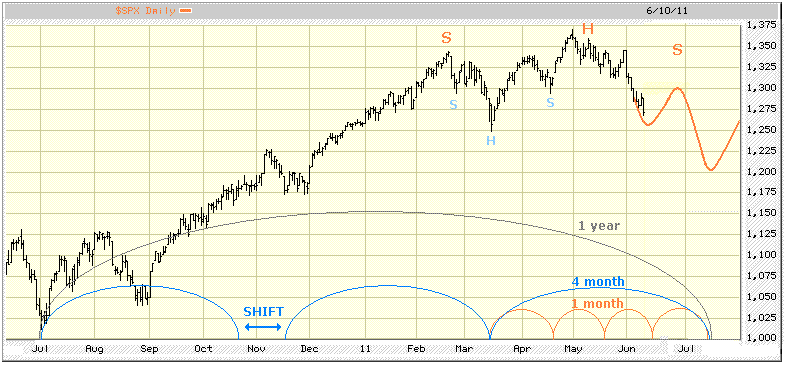
The price is returning to the Japanese tsunami low which was made in March and a bounce here seems likely. If we do bounce, the market will begin forming the right shoulder of a perfect H&S picture.
Whether there is a head fake down out of it once it has formed, remains to be seen, but it works with my timing model.
Cyclical outlook
I have included a chart of the SPX index and on it I have marked the H&S patterns. I have also drawn the different cycles that are effecting the price of the SPX at this time.
We see that two important cycles are now exerting downward pressure. The 1 year cycle only has another month or so until it makes it's next bottom. Right now it should be going hard down.
The 4 month cycle is a very dominant one and it looks like it has rolled over and is going hard down as well. It has one more month before it bottoms. That leaves the 1 month cycle and it is in a position to provide some lift over the next week or so.
The lift which the 1 month cycle provides and the rally it creates, may be truncated. The downward bias of the two larger cycles should overpower it.
Shifts happen
When you look at the chart, you will notice how the 4 month cycle shifted. The 4 month cycle is a reliable one but even it can shift. I never trade solely on cycles. They are great for giving a heads up to an opportunity. Sometimes they seem magical in the way the market follows their lead but I still use a triggering method that must confirm the trade. If prevents losses when a shift occurs.
I mention shifts because the 1 year low is due in less than one month and it can bottom early or late. We need to be vigilant.

Counter trend
The fact that we went up from last July until May, is telling us that there is strong underlying demand for stocks. That is known in cyclical analysis as late translation and it usually means the larger cycles are still pushing up. We also have to factor the presidential cycle into the equation. In the third year of a presidential cycle, we have only had one down year since the 1940's. We can go down in the middle like this but we should be back near the highs as the year end approaches.
Bottom line
The lift from the 1 month cycle, combined with the fact that we are oversold, will give a bounce that should last a week or two. How high it goes will give us some clues about the strength, or maybe I should say weakness, of the larger 4 month and 1 year cycle.
I will be covering shorts and use the next long trigger to set my bias for short term trading, because there is always a chance we make the key 1 year low now. If not, we may not get much above 1300.
I think many believe we will hold the 1250 level but there is still one month before we make the nest of lows that should signal the start of the next up leg. It is an obvious support level and the Fat Boys may use it as a trap. Then the surprise may be to the down side.
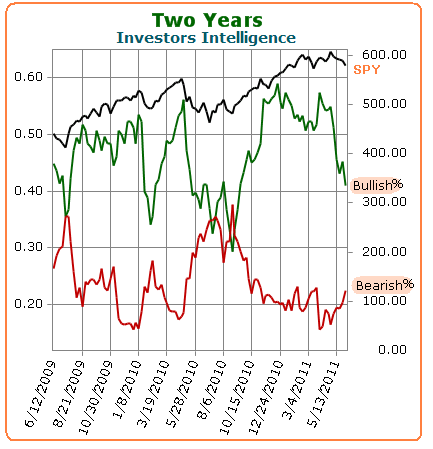
The bullish consensus has shifted from extremely bullish, toward neutral but it is still not nearly bearish enough to confirm a bottom.

Do it yourself
Successful trading requires an understanding of how big trading houses like Goldman, use the markets to pick the pockets of funds and individuals. I offer courses and a comprehensive 5 video set, which takes you step by step through the program they use. When you have learned their trading algorithms, you will always be profitable, in whatever time frame you wish to trade.
Leave the driving to us
Successful money management requires focus and constant attention. Many do not have the time required, nor the desire to acquire the skills.
I have reunited with my former trading partner and now have room for a few new clients in my high return, managed account program.
It offers several very attractive features.
No fees, other than a percentage of profits. Minimum 10 % annual return, or no fees at all. Your money never leaves your account and we never have access to it.
You monitor performance daily. You will see results immediately.
Two managers with over 30 years experience trading S&P futures professionally.
Bob Clark is a professional trader with over twenty years experience, he also provides real time online trading instruction, publishes a daily email trading advisory and maintains a web blog at www.winningtradingtactics.blogspot.com his email is linesbot@gmail.com.
© 2011 Copyright Bob Clark - All Rights Reserved
Disclaimer: The above is a matter of opinion provided for general information purposes only and is not intended as investment advice. Information and analysis above are derived from sources and utilising methods believed to be reliable, but we cannot accept responsibility for any losses you may incur as a result of this analysis. Individuals should consult with their personal financial advisors.
© 2005-2022 http://www.MarketOracle.co.uk - The Market Oracle is a FREE Daily Financial Markets Analysis & Forecasting online publication.


