


The Trend Is Your Friend: How Moving Averages Can Improve Your Market Analysis
InvestorEducation / Learn to Trade Jun 07, 2011 - 01:35 PM GMTBy: EWI

 Many traders and investors use technical indicators to support their analysis. One of the most popular and reliable also happens to be an indicator that has been around for years and years -- moving averages.
A moving average is simply the average value of data over a specific time period. Analysts use it to figure out whether the price of a stock or a commodity is trending up or down. It effectively "smooths out" the daily fluctuations to provide a more objective way to view a market.
Although simple to construct, moving averages are dynamic tools, because you can choose which data points and time periods to use to build them. For instance, you can choose to use the open, high, low, close or midpoint of a trading range and then study that moving average over a time period, from tick data to monthly price data or longer.
Moving Averages can help you identify the trend in a market, which is important since we all know that the trend is your friend. Yet certain moving averages can serve as support or resistance, and also alert you to trading opportunities.
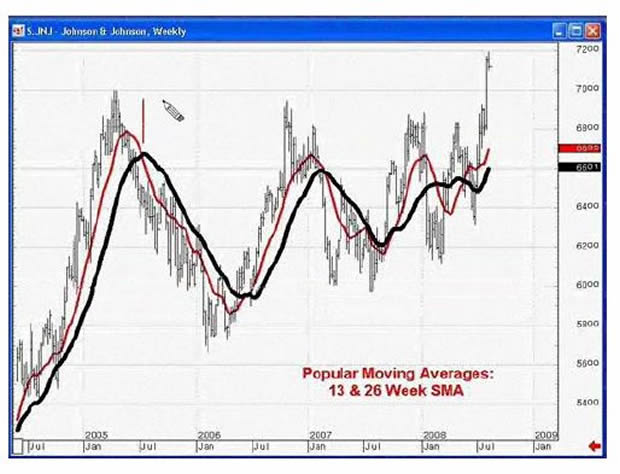
This excerpt from EWI Senior Analyst Jeffrey Kennedy's free eBook, How You Can Find High-Probability Trading Opportunities Using Moving Averages, shows how a popular moving average setting identified trading opportunities in the stock of Johnson & Johnson. Download the full 10-page eBook here.
A popular moving average setting that many people work with is the 13- and the 26-period moving averages in tandem. The figure below shows a crossover system, using a 13-week and a 26-week simple moving average of the close on a 2004 stock chart of Johnson & Johnson. Obviously, the number 26 is two times 13.
During this four-year period, the range in this stock was a little over $20.00, which is not much price appreciation. This dual moving average system worked well in a relatively bad market by identifying a number of buyside and sellside trading opportunities. Learn to apply Moving Averages to your trading and investing by downloading Jeffrey Kennedy's free 10-page eBook. Here's what you'll learn:
- How to apply the three most popular moving average techniques.
- How to decide which moving average parameters are best for the markets and time frames you trade.
- How to avoid several common but dangerous myths about moving averages.
Download How You Can Find High-Probability Trading Opportunities Using Moving Averages now.
This article was syndicated by Elliott Wave International and was originally published under the headline The Trend Is Your Friend: How Moving Averages Can Improve Your Market Analysis. EWI is the world's largest market forecasting firm. Its staff of full-time analysts led by Chartered Market Technician Robert Prechter provides 24-hour-a-day market analysis to institutional and private investors around the world.
About the Publisher, Elliott Wave International
Founded in 1979 by Robert R. Prechter Jr., Elliott Wave International (EWI) is the world's largest market forecasting firm. Its staff of full-time analysts provides 24-hour-a-day market analysis to institutional and private around the world.
© 2005-2022 http://www.MarketOracle.co.uk - The Market Oracle is a FREE Daily Financial Markets Analysis & Forecasting online publication.