


Stock Market Bulls or Bears? Who Is In Control?
Stock-Markets / Stock Markets 2011 Jun 07, 2011 - 01:21 PM GMTBy: Marty_Chenard

 A current update on last week's analysis of Very Strong stocks versus the Very Weak stocks ....
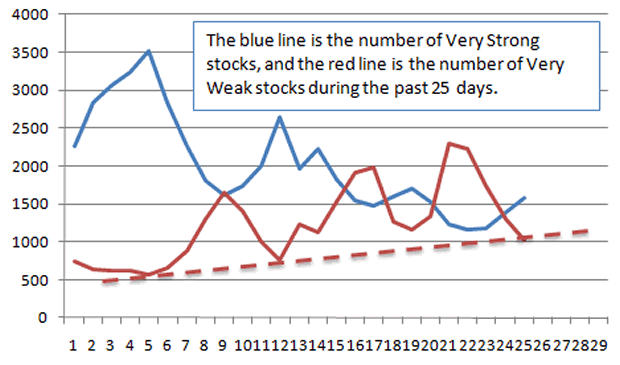
From last week's posting: What if the number of Very Strong stocks in the market was in a "down trend" while the number of Very Weak stocks in an "up trend" ... what would you say?
The chart below shows the actual number of stocks in both categories during the past 25 days. Note that the blue line representing Very Strong stocks has been making lower/lows, while the red line representing Very Weak stocks has been making higher/lows. So this is showing a slight on-going negative bias and one that corresponds to the down trending channel that the SPY has been seeing in the past few weeks. See the next chart for today's update data ...
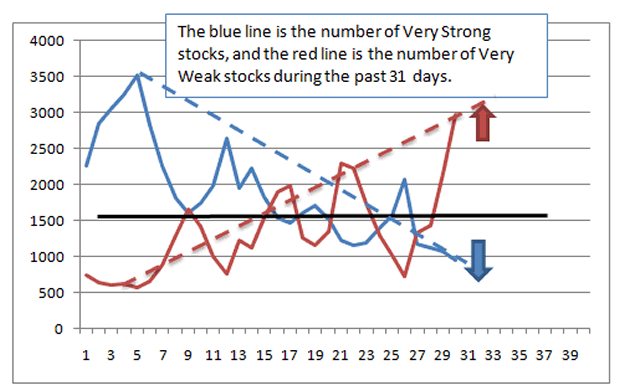
Here is what happened since last week ...
I drew lines from the high/lows which occurred on May 29th, to where the levels were yesterday.
Looking at the chart, is becomes clear that the number of Very Strong stocks have trended lower, while the number of Very Weak stocks took the lead and trended higher. This is saying that the Bears have the advantage over the Bears.
While the chart may look simple, it requires our computers to analyze "every stock" on four major indexes and count how many stocks were getting very strong or very weak on a daily basis. This analysis is run every night and the data is used in Ratio computations that are posted on our subscriber site. (FYI ... "Every stock" is defined as stocks that have a value of at least two dollars or more.)
* Feel free to share this page with others by using the "Send this Page to a Friend" link below.
By Marty Chenard
http://www.stocktiming.com/
Please Note: We do not issue Buy or Sell timing recommendations on these Free daily update pages . I hope you understand, that in fairness, our Buy/Sell recommendations and advanced market Models are only available to our paid subscribers on a password required basis. Membership information
Marty Chenard is the Author and Teacher of two Seminar Courses on "Advanced Technical Analysis Investing", Mr. Chenard has been investing for over 30 years. In 2001 when the NASDAQ dropped 24.5%, his personal investment performance for the year was a gain of 57.428%. He is an Advanced Stock Market Technical Analyst that has developed his own proprietary analytical tools. As a result, he was out of the market two weeks before the 1987 Crash in the most recent Bear Market he faxed his Members in March 2000 telling them all to SELL. He is an advanced technical analyst and not an investment advisor, nor a securities broker.
Marty Chenard Archive |
© 2005-2022 http://www.MarketOracle.co.uk - The Market Oracle is a FREE Daily Financial Markets Analysis & Forecasting online publication.