


Financial Stocks XLF ETF Prevented a Potentially Devastating S&P 500 Trade
Stock-Markets / Stock Index Trading Jun 06, 2011 - 03:53 AM GMTBy: J_W_Jones

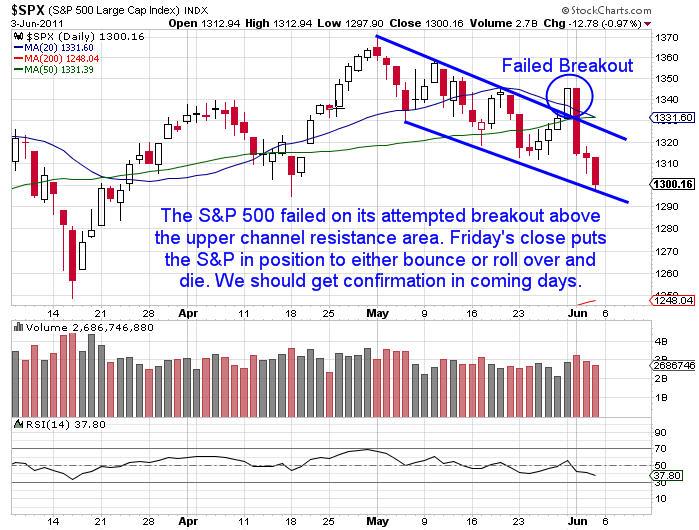
 My most recent analysis regarding the S&P 500 has been proven to be inaccurate as a failed breakout has transpired on the S&P 500 this past week. While there is no such thing as a perfect analyst, I will openly admit that my most recent article proved to be wrong. After I watched as the S&P 500 broke out above the upper channel resistance area I was expecting continuation. What transpired the following day was absolute carnage in the marketplace.
Immediately after breaking out to the upside, the S&P 500 sold off sharply and by the end of the day on Wednesday a failed breakout was obvious. The failed breakout trapped momentum traders as well as those watching and waiting for the breakout to occur. The chart below illustrates the failed breakout and the subsequent sell off that transpired the rest of the week.
Most readers likely believe that I went long when the breakout was imminent before Tuesday's close. However, over the years I rarely chase breakouts unless I see multiple days of price stabilization above breakout levels. Generally a consolidation zone above a key breakout level is bullish. However, in recent months it seems that standard technical patterns have not been working well. In fact, chasing breakouts over the past few years could have produced some ugly losses depending on the underlying and the timing of the breakout.
Armed with recent price action and concern for the S&P 500 giving back gains, I did not get long the S&P 500 for members of my service at OptionsTradingSignals.com. On Wednesday morning, I was leaning long because price action overnight was confirming the breakout. However, when preparing my morning post for members I noted the apathy in the financial complex.
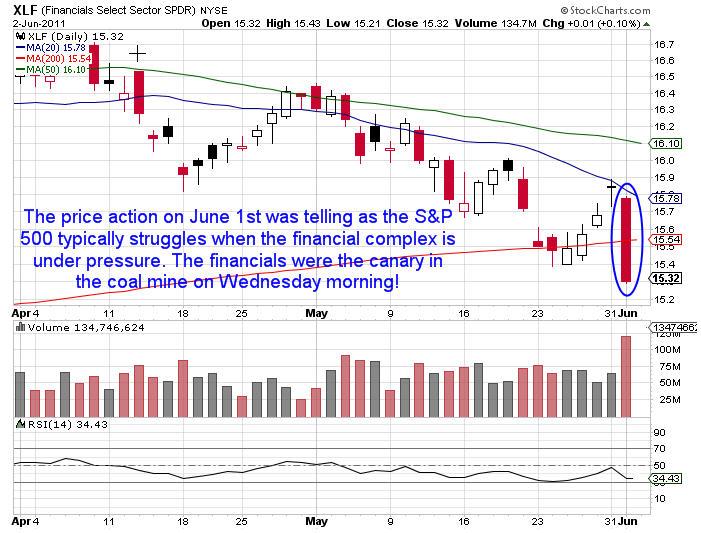
I am constantly monitoring price action in the XLF and Wednesday morning was no exception. The ugly price action in XLF kept me from getting involved in a long S&P 500 trade for members. By late in the day Wednesday, the XLF ETF had proven to be accurate and prevented losses for myself and for members of my service. The chart of XLF at the close on Wednesday looked like this:
The point of the article is not to pat myself on the back for avoiding catastrophe, but to illustrate to readers how important it is to monitor various aspects of the marketplace. I generally focus on the S&P 500, the Volatility Index (VIX), the financial complex (XLF), Russell 2000 (IWM), and the Dow Jones Transports (IYT). Generally speaking a trader can learn a lot about the broad marketplace by monitoring the price action in the underlying assets mentioned above. Often times the Russell 2000 or the financial complex will throw off clues about which direction price action favors.
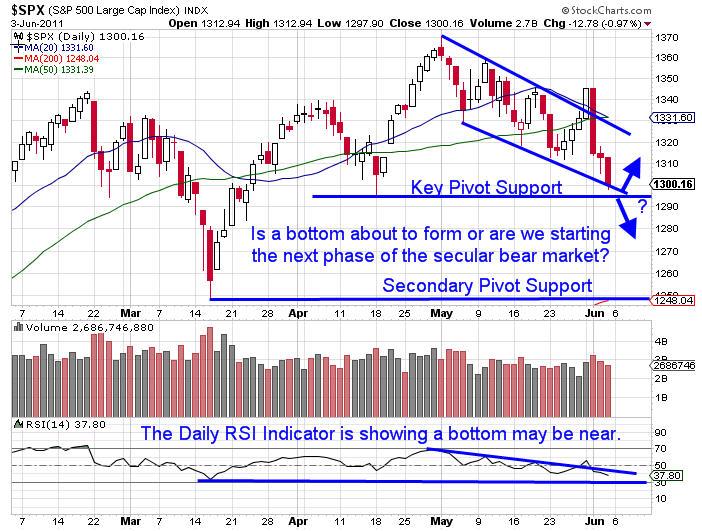
At first glance, we could see the S&P 500 bounce higher in coming days as it is coming into a key pivot low that dates back to April 18th. I am expecting some buying support to step in around that price level as it also corresponds with the lower bound of the recent descending channel the S&P 500 has been trading in.
While we may see further downside, the April 18th pivot low should offer a solid risk definition area for traders. If prices push lower, a short trade using a stop somewhere around or above the key 1,295 price level would make sense. Those looking to take the S&P 500 long could place a stop order below the key 1,295 price level to define risk.
Regardless of where one believes the S&P 500 is headed, using a key support/resistance level to place trades with limited risk makes a lot of sense currently. I will be patient and wait for the market to throw off clues as to which direction it favors before accepting additional risk. The primary focus for traders during periods of wild price action should be to concentrate on reducing risk and allowing others to do the heavy lifting. A trader or an investor can learn a lot about the strength of an underlying asset or index by simply watching the price action while sitting on the sidelines. The daily chart of the S&P 500 Index below illustrates the key pivot level:
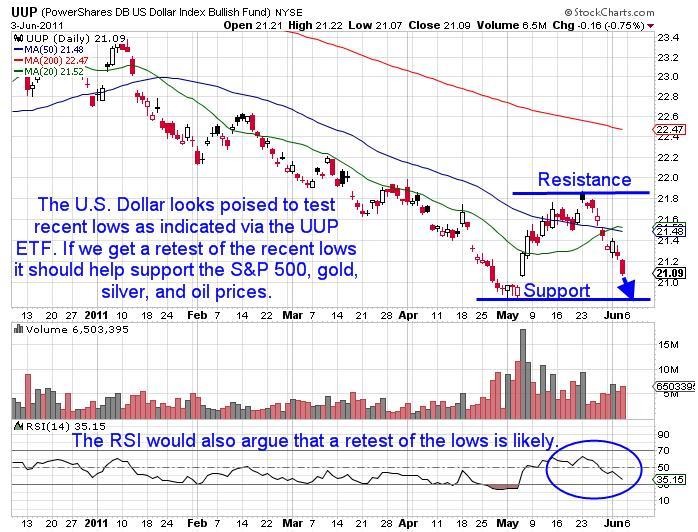
Obviously the S&P 500 is coming into a key support zone, but another factor which cannot be ignored at this point in time is the U.S. Dollar Index. On Friday, the U.S. Dollar pushed significantly lower and most of the key commodities such as gold, silver, and oil all closed the day near day highs and well off of intraday lows. The U.S. Dollar Index looks vulnerable currently as its recent rally seems to be short lived and it appears to be poised to retest the recent lows. The daily chart of the U.S. Dollar ETF (UUP) is shown below:
The first 2 – 3 trading days of this week should provide us with clues in terms of price action in the S&P 500 and the U.S. Dollar. If the U.S. Dollar continues to weaken it should help support the S&P 500 and the commodity complex. For right now I'm going to sit on the sidelines and wait for the price action to setup before taking on additional risk. The key level to watch is the 1,295 level on the S&P 500 and recent lows on the U.S. Dollar Index.
With QE II winding down and price action starting off the month relatively ugly, June could shape up to be a very interesting month for investors and traders alike. I will be out later this week with an updated analysis after I see the price action the next few days. Until then, I would keep positions smaller than normal and protect capital using stop orders. Anything could happen, but this is the closest we have been to rolling over in the S&P 500 for months. I do not have my helmet on yet, but in a couple of weeks depending on price action I might have to wipe the dust off of it.
If you would like to be informed several times per week on SP 500, Volatility Index, Gold, and Silver intermediate direction and options trade alerts… take a look at http://www.optionstradingsignals.com/specials/index.php today for a 24 hour 66% off coupon, and/or sign up for our occasional free updates.
J.W. Jones is an independent options trader using multiple forms of analysis to guide his option trading strategies. Jones has an extensive background in portfolio analysis and analytics as well as risk analysis. J.W. strives to reach traders that are missing opportunities trading options and commits to writing content which is not only educational, but entertaining as well. Regular readers will develop the knowledge and skills to trade options competently over time. Jones focuses on writing spreads in situations where risk is clearly defined and high potential returns can be realized.
This article is intended solely for information purposes. The opinions are those of the author only. Please conduct further research and consult your financial advisor before making any investment/trading decision. No responsibility can be accepted for losses that may result as a consequence of trading on the basis of this analysis.
© 2005-2022 http://www.MarketOracle.co.uk - The Market Oracle is a FREE Daily Financial Markets Analysis & Forecasting online publication.