Stock Market S&P 500 Structure and Momentum
Stock-Markets / Stock Markets 2011 Jun 05, 2011 - 10:19 AM GMTBy: Piazzi
 In this post of May 20, I used weekly Momentum Cycle, OEW aggregate trend, and Market Alignment Index indicators to sum up the state of S&P in 4 words
“Structurally positive, but weak!&
In that same post, I said:
“It’s not a disastrous situation. All three indicators are still above zero denoting a positive tilt to aggregate trend (as measured by OEW) and aggregate structure (as measured by MAI). The weekly momentum cycle we just saw is also above zero (dropping but above zero). So the situation is not terribly negative, but it reeks of internal weakness, like a patient with a serious yet curable disease. The cure of the market’s disease at this time is money deployed on the bid side.”
It seems like our proprietary indicators were correct spotting structural weakness 2 weeks ago
Let’s look their current status
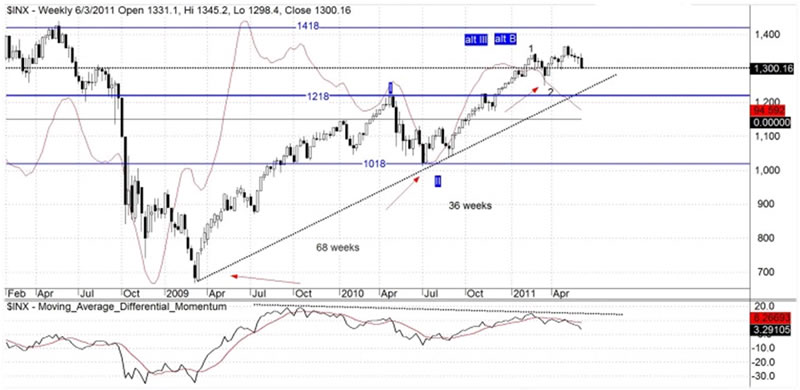
Weekly momentum cycle (red graph) is still pointing down

Notice that the price low of March has so far not fetched a momentum low. Price has now dipped to an important area of support (1295-1305). A break of this area may accelerate selling and make the March low susceptible to a retest or even a break.
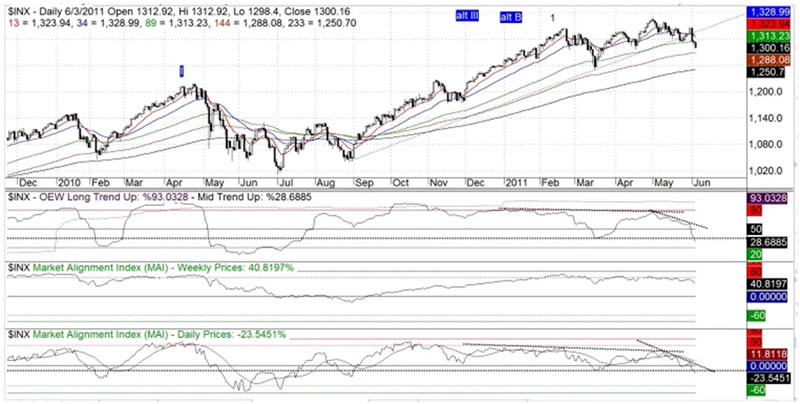
This is a daily chart with OEW aggregate trend, and Market Alignment Index (MAI) indicators

If you compare the current status of chart above with its status of the post of May 20 you will notice that the indicators have deteriorated rather significantly.
These indicators measure aggregate trend and aggregate price structure of all constituents of the index. Deteriorating structure cannot hold price and that’s what we warned then and that’s what we see now.
The only somewhat positive is that, while mid-term OEW and daily MAI have dipped below their respective March lows, price itself is still above its March low. This is price positively diverging from structure at this point. Will that lead to a bottom good enough soon for at least a tradable rally?
All I can say is what I said back in the post of May 20:
Market structure reeks of internal weakness, like a patient with a serious yet curable disease. The cure of the market’s disease at this time is money deployed on the bid side — we need buyers.
In that post of May 20, I also said:
“Weak structure is a sign that buyers are lacking. We need buyers to hold support, strengthen the internals and then lift the index. We need them while mid-term trend is up and index is above support”
Buyers did not show and we now have a mid-term downtrend.
For me to take bulls seriously, they should take a very small first step and get a swing low. They should then take a very small next step and get a short-term uptrend. After that, we’ll see how good they are maintaining a short-term uptrend and squeezing the shorts.
Piazzi
Piazzi offers a premium service at http://www.markettimepremium.com
And blogs freely at http://markettime.blogspot.com
I am a self taught market participant with more than 12 years of managing my own money. My main approach is to study macro level conditions affecting the markets, and then use technical analysis to either find opportunities or stay out of trouble. Staying out of trouble (a.k.a Loss) is more important to me than making profits. In addition to my self studies of the markets, I have studied Objective Elliott Wave (OEW) under tutorship of Tony Caldaro.
© 2011 Copyright Piazzi - All Rights Reserved Disclaimer: The above is a matter of opinion provided for general information purposes only and is not intended as investment advice. Information and analysis above are derived from sources and utilising methods believed to be reliable, but we cannot accept responsibility for any losses you may incur as a result of this analysis. Individuals should consult with their personal financial advisors.
© 2005-2022 http://www.MarketOracle.co.uk - The Market Oracle is a FREE Daily Financial Markets Analysis & Forecasting online publication.


