


Stock Market Continues to Consolidate
Stock-Markets / Stock Markets 2011 May 31, 2011 - 04:42 AM GMTBy: Andre_Gratian

 Very Long-term trend - The continuing strength in the indices is causing me to question whether we are in a secular bear market or two consecutive bull/bear cycles. In any case, the very-long-term cycles are down and, if they make their lows when expected, there will be another steep and prolonged decline into 2014-16.
Long-term trend - In March 2009, the SPX began a move which evolved in a bull market. Cycles point to a continuation of this trend for several more months.
SPX: Intermediate trend - The intermediate trend is still intact. After the 1370 projection was reached, the SPX started a normal consolidation pattern which is ongoing, but nearly complete. The intermediate uptrend is expected to resume afterwards.
Analysis of the short-term trend is done on a daily basis with the help of hourly charts. It is an important adjunct to the analysis of daily and weekly charts which discusses the course of longer market trends.
Market Overview
Last week, I wrote the following: "If the reversal which took place at 1319 is legitimate, we could have its confirmation as early as Monday." Needless to say, last Monday brought about an "un-confirmation" instead, to say the least.
On Tuesday 5/24 the SPX started another near-term uptrend from 1312 which reached 1333 by the end of the week. Is there any chance that this rally becomes a legitimate end to the correction? Maybe! Because the 14-15-wk high-to-high cycle is due to top in about a week and, assuming that it is the cause of this rally, and that it will bring about a high and not a low, the upward push could extend by several more points until the cycle has made its high (ideally 6/6). Then, a reversal should take place, perhaps bottoming on 6/13, the date on which the Armstrong 8.6-yr cycle is due.
Using cycles for market forecasting can be helpful, but I have learned to take them with a grain of technical salt, meaning that, based on experience, I take the cycles into consideration, but rely primarily on what my technical indicators are saying; especially when several cycles are clustering in a narrow time frame (like now) -- and some of them have a history of inverting!
The base created by the SPX Point & Figure chart, before and after the 1312 low, is suggesting that we could go higher, and perhaps challenge the down-trend line before ending the near-term uptrend. In any case, if the 14-15-wk cycle is the cause of this rally, it will end - at least temporarily -- when the cycle reverses.
It is difficult to draw a solid conclusion from the current market position. The correction may have a little more to go before a legitimate reversal marks the end of it. However, the near-term uptrend has moved prices within a couple of points to the down-trend line of the correction pattern without giving a sell signal, and if we go through, it is almost certain to encourage more buying. Next week is likely to be pivotal in determining whether or not the correction has ended.
Let's look at the charts to see if we find more clues!
Chart Analysis
Starting with the Daily SPX Chart, the first thing we notice is that, after showing some deceleration, the index has violated its intermediate-trend channel for the first time. This is a warning that we may be coming to the end of that trend.
The index may be in the process of back-testing that broken trend line, and the rally could end in the vicinity of the black asterisk representing the 14-15-wk cycle high. Considering what the reversal of this cycle has meant in the past, it could be followed by significant short-term weakness, as is demonstrated on the chart. The difference with this phase and the past three that are shown, is that this time, the top would not come at a market high, but after a correction which has already lasted four weeks. This may take the sting out of the reversal. Nevertheless, let's let the market tell us how it wants to handle this condition.
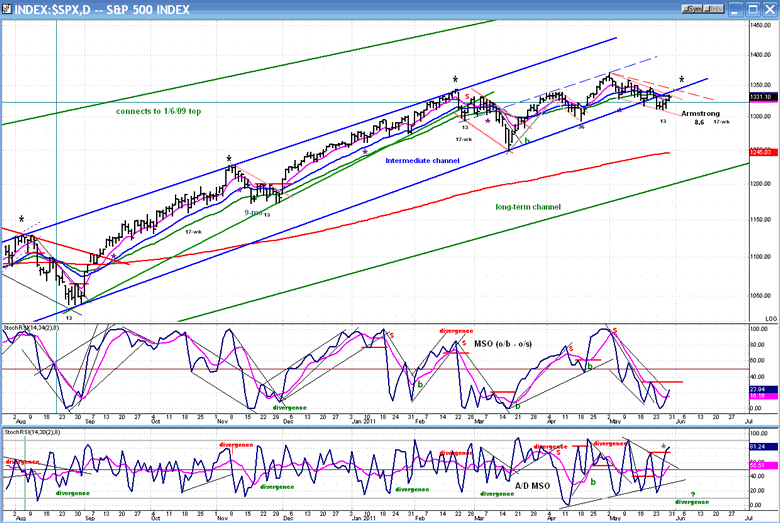
Looking next at the indicators, they imply that we are closer to a low than to a high. The Price MSO has already reached an oversold condition and turned up. There was no divergence when it became oversold and this diminishes the odds of this turn marking a final low in the market. However, since the rally could extend higher, the indicator could break above its previous top before it turns down again, as the A/D indicator has already done. This would be a bullish sign that would alert us to a potential end to the correction.
Whatever the indicators "indicate", the SPX would need to close above 1348 on a daily basis to suggest that it has definitely turned the corner and is now ready to make new highs.
The Hourly Chart shows more clearly the intricate pattern of channels and trend lines which make up the correction. After rallying from the 1312 low, the SPX has overcome the channel median and has risen into the upper half of the down-channel. On Friday, it found some tough resistance at the intersection of the broken trend line, an internal (gray) trend line, and its 200-hr MA. Yet, it has given back hardly any ground which is a sign of strength. If it overcomes that resistance, it could easily go through the top channel line and challenge the dashed parallel to the line connecting the lows.
There are a few bullish things in its favor: some higher potential counts from the P&F chart, a cycle top which is still (ideally) a few days away, and indicators which, although overbought, only show minor divergence in the A/D, and no divergence in the price MSO. The MACD even shows positive divergence since it has already gone above its previous high.
Also, note that the base pattern was completed over a longer period of time, and is more extensive than the two previous lows of the correction. If the entire width of the base pattern can be legitimately counted to project an ultimate objective for the rally, there is enough of a count to take it to a new high and the ultimate target which has been discussed before.
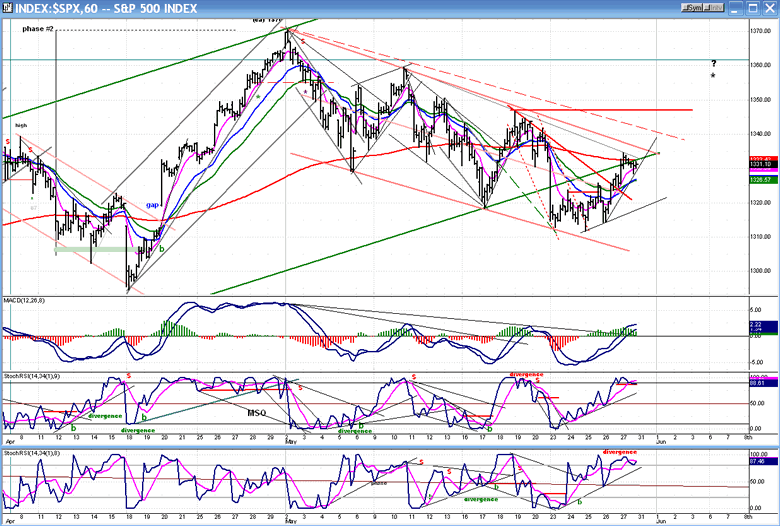
The daily indicators fell short of giving a buy signal on Friday, but if we continue the rally over the next couple of days, they could give one, especially if the SPX closes above 1348 on a daily basis. Even though the hourly indicators are already extended, they have not given a sell signal and this could mean more price appreciation ahead. If the daily trend takes over, the hourly indicators can stay overbought for some time.
Cycles
The 13-wk cycle could have been responsible for the pull-back, last week.
The 14-15-week top-to-top cycle is ideally due on (6/6). It may be acting as a magnet on prices and causing the current rally. However, we need to keep in mind that it has occasionally inverted in the past.
Martin Armstrong's 8.6-yr economic cycle is due on 6/13-16. There has been enough correlation between the Economic Model and the market's behavior that we should pay attention to that date. The 2007.15 date of his economic cycle accurately marked the top of the XLF, and it led other indices in a severe bear market.
The 17-wk cycle appears to have lost the dominance that it enjoyed in 2009-2010, but can still have an effect on the market. It is due around 6/20.
Breadth
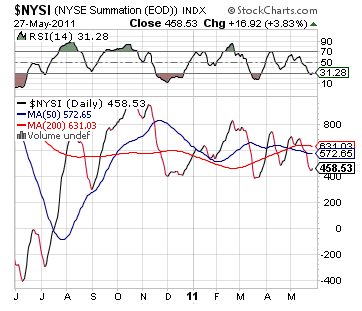
The NYSE Summation Index (courtesy of StockCharts.com) continues to trade in a range which it has observed since December of last year. Currently, both the index and its RSI are at the bottom of that range and again could start rising.
Sentiment
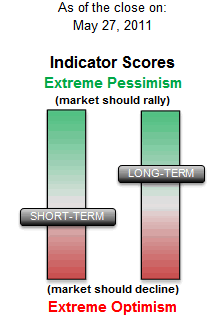
The long-term SentimenTrader (courtesy of same) has grown more bullish with every market pull-back. This is a pattern which will inevitably result in a resumption of the intermediate-term uptrend for the SPX. If, as this uptrend progresses, it should become extremely bearish, it will signal the strong probability of an intermediate reversal.
The SentimenTrader is not a timing tool. This is the specialty of other indicators. But the direction in which it moves is a strong indication of where the market is heading.
The VIX is another reliable indicator. It can be read just like any other stock or index, using trend lines, channels, indicators etc… Currently, it has a resistance bar set at 20. As long as that level is not crossed decisively, the bulls are not in trouble. An attempted break-out last Monday failed, and it closed the week at 15.98.
Other leading indicators which I follow are either bullish or neutral.
Dollar index
This is a chart of UUP, the dollar ETF. The index had been in a decline since June, 2010. In early May, it showed some reluctance to going below the median of its down-channel at the same time that it reached a P&F projection, thereby indicating that it was probably at a turning point. This was confirmed when good buying surfaced sending the index to the top channel line, where it met some resistance and started backing-off.
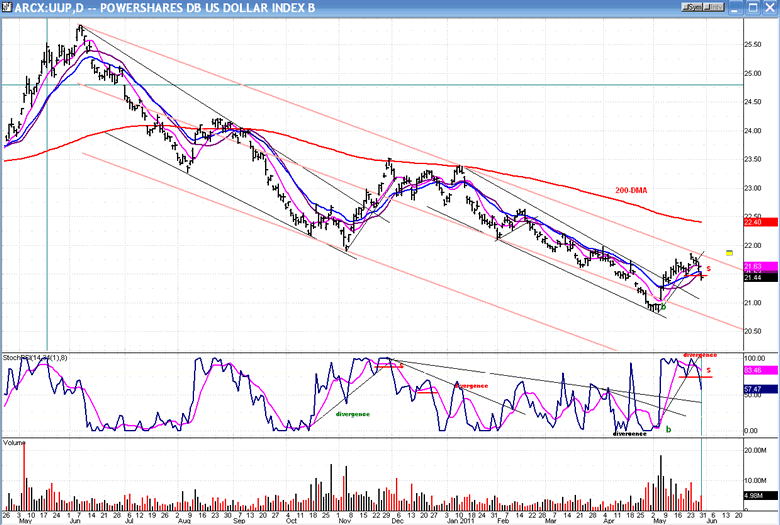
Coincidentally, after reaching a low of 72.70,the dollar has also rallied to a high of 76.3 before retracing.
Neither UUP, nor the Dollar has made enough of a base on the P&F chart to give us an idea of where they might go from here. It looks as if a correction is underway which may test the low in some form, but it could merely be a correction in the uptrend which has already started.
Based on a number of factors, it is possible that the dollar is at the beginning of a significant uptrend. The best way to confirm this would be the UUP moving out of its red down-channel, and then rallying past the 200-DMA, which has proven to be formidable resistance in the past.
Gold
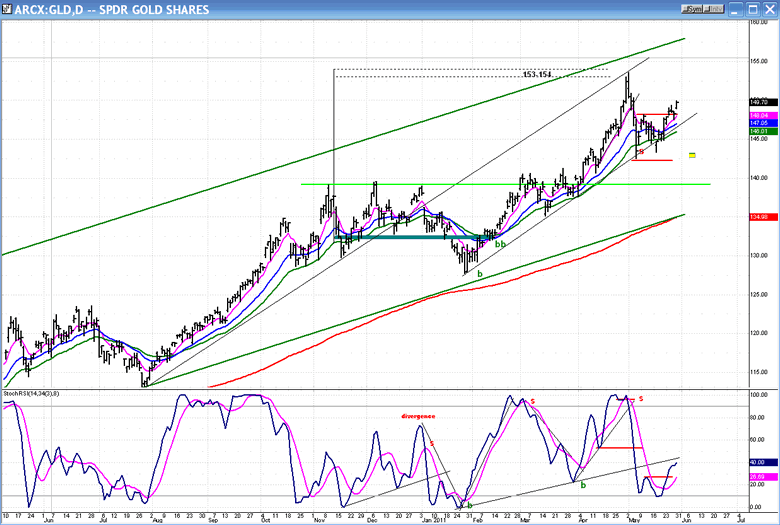
Gold has recovered from its sharp drop and is moving back up toward its former high. The small base that GLD made at the 145 level gives it a count to 155. When it gets there, it is likely that its indicator will show some serious negative divergence, and that it will be ready for a deeper correction.
Oil
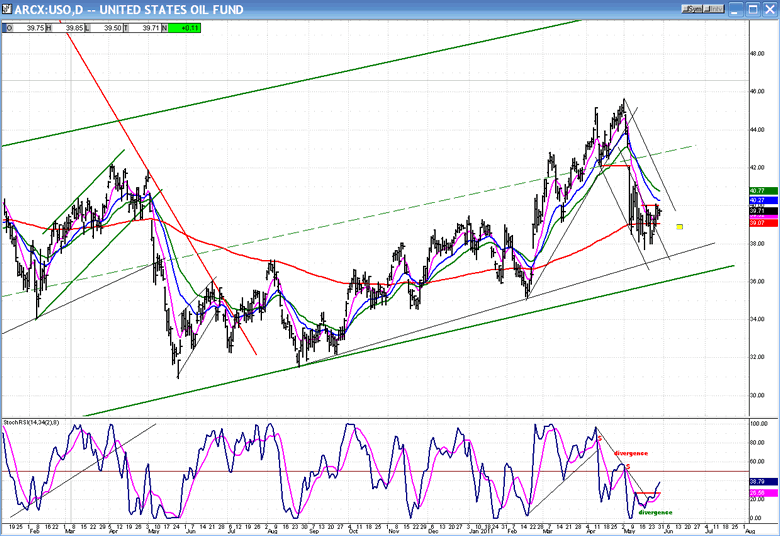
The chart of USO, below, shows that oil has not recovered from its sell-off nearly as well as gold. It is not likely that it will rally anywhere close to its former high, and the next selling spell may take it below the 38 level.
The index has found support on its 200-DMA. If it breaks below, it will challenge its long-term trend line at around 36.00.
WTIC also could be making an intermediate top. Since the distribution pattern is not yet finished, we can't get an exact projection, but after the market makes a top, a retracement to about 90 looks likely.
Summary
The SPX is still in an intermediate up-trend within a long-term uptrend. Over the short-term, it has been undergoing a consolidation.
In order to end this consolidation and resume its uptrend, the index must move decisively above 1348 with good breadth support. A break of 1295 would significantly worsen its position.
The near-term trend which is underway originated in a good base formation which developed above 1312 and which carries the potential for higher prices, perhaps including that of making new highs if taking the entire base count is found to be valid.
Notice:
In order to provide a more comprehensive market analysis, from this point on, the Dollar, Gold, and Oil will only be analyzed in the first newsletter of each month, and be replaced by the analysis of- the QQQ, DJIA, XLF, and TLT.- However, they will be updated on a daily basis in the Market Summary for the benefit of subscribers.
A Market Summary is now made available to subscribers every morning as part of the Morning Comment.- The following, which went out on Friday morning, is an example:
Daily indicators need more work before signaling that a low for the short-term downtrend has been reached. So far this is only a near-term uptrend which may not have much farther to go.-
Hourly price indicators are not showing any divergence, but the A/D indicators are.- This could be a warning that they will be in a position to forecast a pull-back when (if) we reach 1329-30 on the SPX.
There are a number of cycles due over the next 3 weeks, all capable of influencing the market.- The first is ideally due next Friday and some analysts are making the (perhaps erroneous) assumption that it will be a high.- Although it usually makes a high on its due date, it has occasionally inverted and I will be prepared for that possibility.-
It is also possible that we are not making a base, but a corrective up-wave.- There are still murky issues ahead, and we'd better let the hourly indicators guide us through the fog until the daily indicators have reversed and signal a new short-term uptrend.-
With the 16-point rally, short-term sentiment has turned bearish, but long-term is still solidly bullish.
(Commentaries on the Dollar, Gold, and Oil will begin next week.)
FREE TRIAL SUBSCRIPTON
If precision in market timing for all time frames is something which is important to you, you should consider a trial subscription to my service. It is free, and you will have four weeks to evaluate its worth.
For a FREE 4-week trial. Send an email to: ajg@cybertrails.com
For further subscription options, payment plans, and for important general information, I encourage you to visit my website at www.marketurningpoints.com. It contains summaries of my background, my investment and trading strategies and my unique method of intra-day communication with Market Turning Points subscribers.
By Andre Gratian
MarketTurningPoints.com
A market advisory service should be evaluated on the basis of its forecasting accuracy and cost. At $25.00 per month, this service is probably the best all-around value. Two areas of analysis that are unmatched anywhere else -- cycles (from 2.5-wk to 18-years and longer) and accurate, coordinated Point & Figure and Fibonacci projections -- are combined with other methodologies to bring you weekly reports and frequent daily updates.
“By the Law of Periodical Repetition, everything which has happened once must happen again, and again, and again -- and not capriciously, but at regular periods, and each thing in its own period, not another’s, and each obeying its own law … The same Nature which delights in periodical repetition in the sky is the Nature which orders the affairs of the earth. Let us not underrate the value of that hint.” -- Mark Twain
You may also want to visit the Market Turning Points website to familiarize yourself with my philosophy and strategy.www.marketurningpoints.com
Disclaimer - The above comments about the financial markets are based purely on what I consider to be sound technical analysis principles uncompromised by fundamental considerations. They represent my own opinion and are not meant to be construed as trading or investment advice, but are offered as an analytical point of view which might be of interest to those who follow stock market cycles and technical analysis.
Andre Gratian Archive |
© 2005-2022 http://www.MarketOracle.co.uk - The Market Oracle is a FREE Daily Financial Markets Analysis & Forecasting online publication.