


Stock Market Clues in Vertical Credit Spreads and the Russell 2000
Stock-Markets / Stock Markets 2011 May 29, 2011 - 03:42 AM GMTBy: J_W_Jones

 Before discussing why I think the S&P 500 may be setting up to rally I have to discuss an options strategy that often times is overlooked. Besides writing covered calls and cash-secured naked puts (same risk profile by the way), one of the most basic spread constructions available to option traders is the vertical spread.
A vertical spread can be written when an option trader believes prices are going up (bull call spread) or when prices are going down (bear put spread). In addition to the previous trades which are placed as debit trades, option traders also have the ability to place vertical credit spreads too. While vertical spreads regardless of nature are a very basic option trading strategy, they can produce strong returns with defined risk.
A brief description of a vertical debit spread involves buying a call or put and simultaneously selling a strike further away from the money. Vertical debit spreads always have a directional bias depending on whether calls or puts or used. The sale of the call or put that is further away from the money results in a credit and helps reduce the total cost of the spread thereby reducing the capital risk. A call debit spread, also called a bull call spread is used when a trader expects higher prices. A put debit spread, also called a bear put spread is utilized when the option trader expects lower prices.
A vertical credit spread is established in the opposite construction of a vertical debit spread. The construction involves selling a call or put that is closer to the money and buying a strike that is further away from the money. This strategy profits from time decay as well as price action. The maximum gain is limited to the difference in the credit received for the contract that is sold and the debited premium that is required to purchase the long strike. Vertical credit spreads always result in a trader receiving a credit. A call credit spread, also known as a bear call spread is used when an option trader is expecting lower prices. A put credit spread, also known as a bull put spread is utilized when an option trader expects higher prices.
I typically use vertical debit spreads when I want to place a trade that has defined risk and when I am expecting an underlying's price action to move in a specific direction. However, vertical credit spreads are often overlooked by many traders and this is most certainly a mistake. My favorite time to utilize a vertical credit spread is when price action across the equity indices is ugly. In fact, a nasty selloff where implied volatility is juiced in most equities presents an outstanding opportunity to construct vertical credit spreads.
With the commodity complex getting hammered recently as the U.S. Dollar increased in value, a lot of the agriculture based companies have suffered. The ETF MOO as an example has lost close to 10% from recent highs. I was stalking $MOO looking for a bottom in the price action and on May 23 I looked on as MOO was close to testing its 200 period moving average shown below:
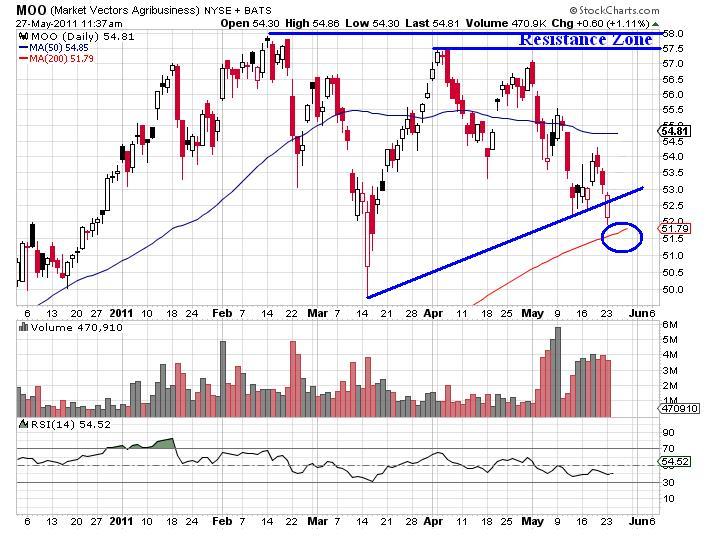
I had also been stalking Deere & Company (DE) for a while looking for a bottom. As it turns out, $DE is the single largest individual holding held in the MOO ETF. When I saw MOO bounce near its 200 period moving average while at the same time I looked on as $DE closed in on its 200 period moving average I felt that we were near a short to intermediate term bottom in the agriculture space. I immediately looked at the $DE option chain as well as the historical implied volatility chart. The trade offered solid risk definition as the 200 period moving average was my support level and credit spreads offer an option trader precise capital risk attributes.
Since Deere & Company had been under significant selling pressure implied volatility was elevated which would also put the wind at my back. When writing credit spreads, implied volatility is critical and must be monitored. I knew I was selling juiced option premium as the implied volatility was historically elevated. The closest at the money strike on the put side was the June DE 80 Put contract. I proceeded to sell the June DE 80 Put contracts and bought the June DE 77.50 Put contracts in a 1:1 ratio to setup the spread.
The maximum risk per put credit spread was $197. The maximum gain was $53 per spread. At expiration the maximum yield would be earned if $DE closed at $80/share or more. The maximum yield of the trade would be 27% (53 / 197) based on maximum risk. The profitability curve of the DE Put Credit Spread is shown below:
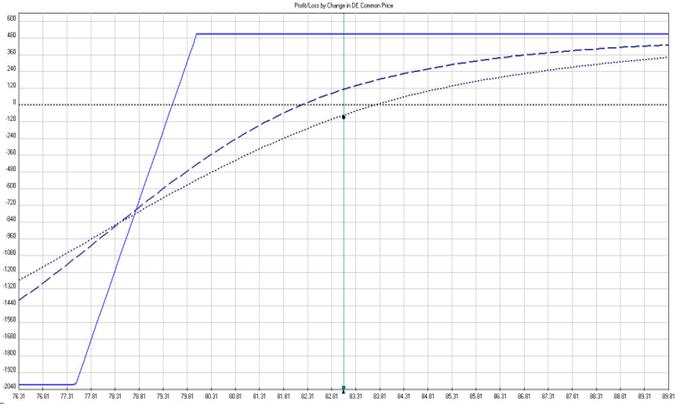
I had absolutely no intention of holding this trade to expiration. In fact, my trading plan was to close the trade as soon as a 15% return based on max risk was reached. I employed a hard stop based on the underlying Deere & Company stock price of $80.90 /share. Essentially the trade had a 1:1 risk versus reward ratio (also referred to by traders as a 1R trade). I entered the trade and at this point still have the trade open, but with the higher prices I am seeing this morning (Friday) in $DE, I will be closing my trade with a gain near 15% of my maximum risk and 100% of my hard stop based risk.
Often times option traders overlook basic trading strategies like a vertical credit spread. In a stock market correction or in a situation where a particular underlying has been under selling pressure for quite some time and implied volatility is juiced and a major support/resistance level is nearby, vertical credit spreads offer solid risk / reward. Often times option traders fail to use basic strategies like vertical spreads which provide them the opportunity to trade around bounces, topping patterns, and bottoming patterns without the total capital risk associated with buying/shorting stock.
Russell 2000 Index (IWM)
Members of the service I run are used to seeing analysis about the Russell 2000 Index on a daily basis. Every day I monitor the price action in the Russell 2000 Index (IWM), the Dow Jones Transportation Index (IYT), and the financial complex (XLF). Quite often one, if not all of these ETF's start throwing off clues about Mr. Market's favored market direction.
During strong moves in the market, all 3 ETF's will generally be moving in the same direction regardless of whether prices are going up or down. If the move is strong and has momentum they all move the same way, but generally speaking one of the ETF's displays relative strength against the S&P 500 and the other ETF's.
Recently the Russell 2000 Index started showing signs of life and then the transports and financials followed the small caps higher. While both the Transports (IYT) and financials (XLF) traded higher the past two days, neither have had the relative strength that the Russell 2000 ETF (IWM) has shown. When the small caps speak, I listen and they have been screaming the past two days that higher prices may be likely next week and into the first week of June. However, as the daily chart of IWM below illustrates, they have some major work to do the rest of Friday and next week.
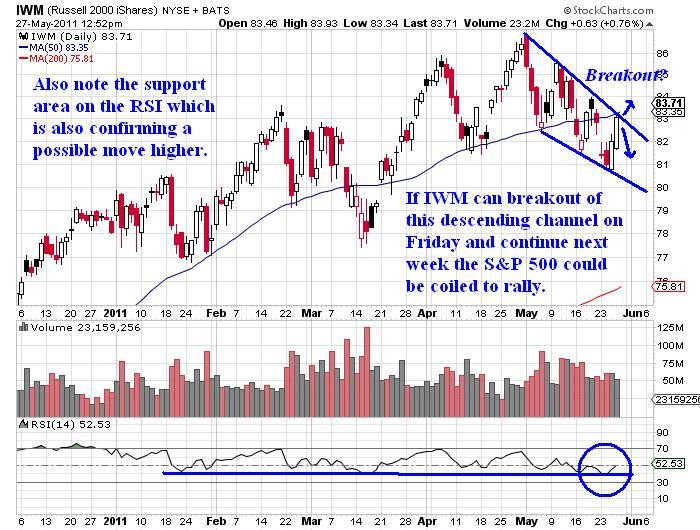
If the price action in IWM can push above the upper bound of the recent downtrend and show continuation higher, we will likely watch as the S&P 500 pushes up to the key 1340 price level for a retest. If the S&P 500 is able to penetrate the resistance area I believe we will likely see the 1,400 – 1,450 S&P price level come into play. The daily chart of the S&P 500 Index (SPX) is shown below:
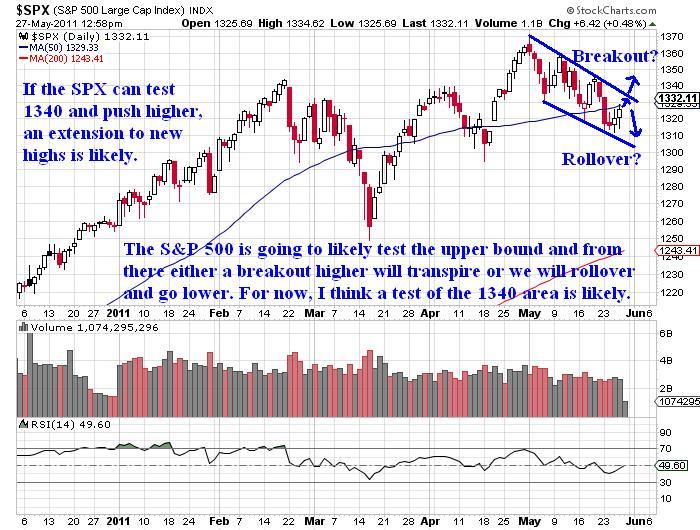
I am leaning bullish on the S&P 500 and risk assets in general (commodities) going into the final week of May and the early part of June. I am expecting a news event to move the markets in a big way within the first few weeks of June. My guess is that an announcement coming out of Europe will be the headline that finally pushes the market into overdrive. For right now, the price action is coiled and we are about to witness a big move.
While I am leaning bullish, I am certainly not willing to risk capital in an attempt to game price action. I will sit back and wait for price action to confirm and pick my spots. Anticipatory trades do not fit my risk tolerance or trading style and I consider them sophisticated gambling. I’m going to let others do the heavy lifting and wait for confirmation about the trend’s direction. At this point in time, the small caps are signaling that higher prices are likely for equities but the real question is whether Mr. Market is just toying with us and this is nothing more than a head fake. Risk is excruciatingly high.
If you would like to be informed several times per week on SP 500, Volatility Index, Gold, and Silver intermediate direction and options trade alerts… take a look at http://www.optionstradingsignals.com/specials/index.php today for a 24 hour 66% off coupon, and/or sign up for our occasional free updates.
J.W. Jones is an independent options trader using multiple forms of analysis to guide his option trading strategies. Jones has an extensive background in portfolio analysis and analytics as well as risk analysis. J.W. strives to reach traders that are missing opportunities trading options and commits to writing content which is not only educational, but entertaining as well. Regular readers will develop the knowledge and skills to trade options competently over time. Jones focuses on writing spreads in situations where risk is clearly defined and high potential returns can be realized.
This article is intended solely for information purposes. The opinions are those of the author only. Please conduct further research and consult your financial advisor before making any investment/trading decision. No responsibility can be accepted for losses that may result as a consequence of trading on the basis of this analysis.
© 2005-2022 http://www.MarketOracle.co.uk - The Market Oracle is a FREE Daily Financial Markets Analysis & Forecasting online publication.