


Buying Stocks At Alternative Entry Points
Stock-Markets / Stock Markets 2011 May 28, 2011 - 11:27 AM GMTBy: David_Grandey

 Say it with us! Pullbacks Off Highs and grand slams to the 50-day average are the only two patterns you’ll ever have to know. Be it in uptrending markets or even in markets where some would say “Market In Correction”
Let’s review with some charts of our current holdings
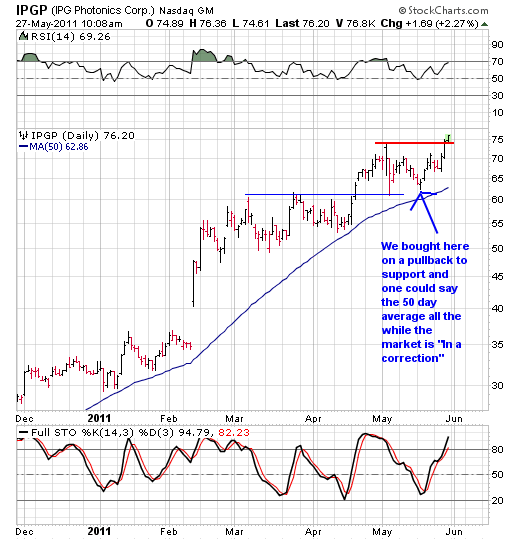
IPGP
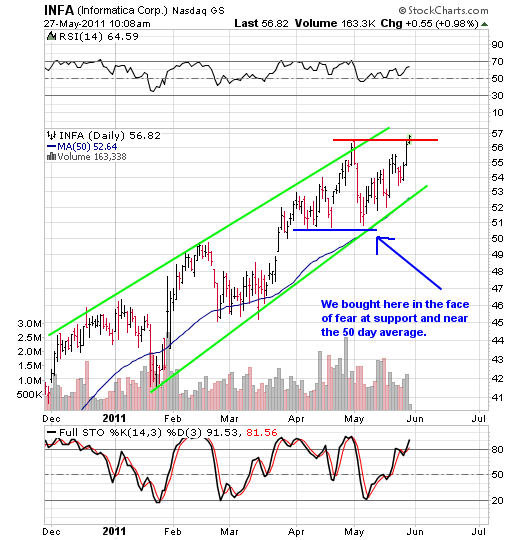
INFA
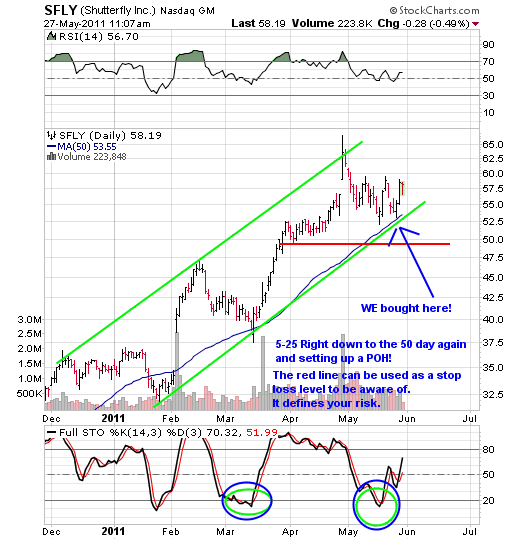
SFLY
ILMN
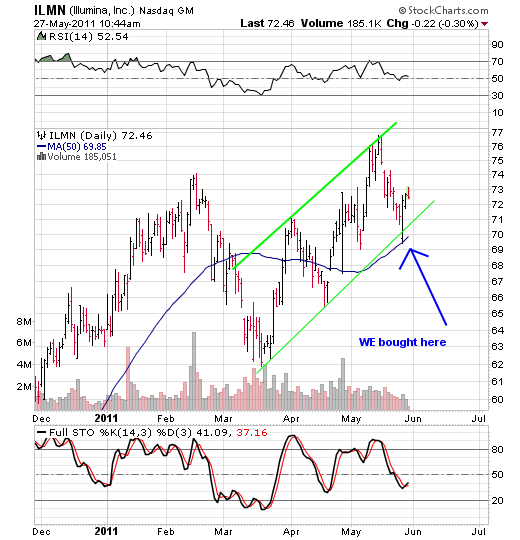
Look at each one. What do you see? For the most part they are all issues in uptrends and above the 50 day average. They either completed a pink line POH or they pulled back to the 50 day or a prior support level. It’s really as simple as that. No need to make life any harder than it is by thinking things through too much.
In addition to the above make sure you check out our current watch list err shall we say the “Featured But Not Trade Triggered By Us List” as the bulk of them all triggered and have moved away from prime entries.
Remember all the while the markets are in a correction this took place. This IS the reason why we eat, sleep and live the statements of:
“Let your stocks tell you what to do by the action they exhibit”
“We trade what we see, not think, hear or fear”
On to the indexes
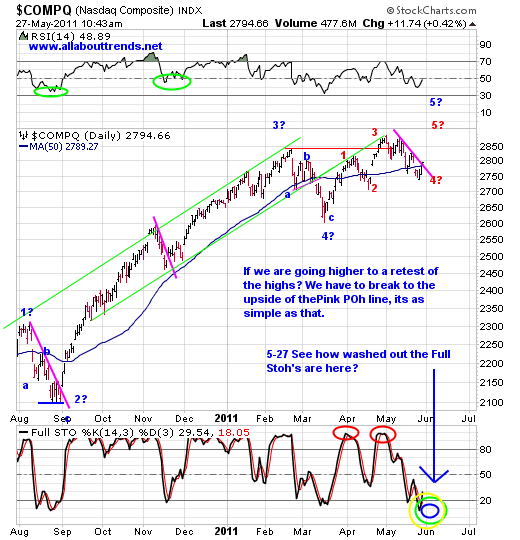
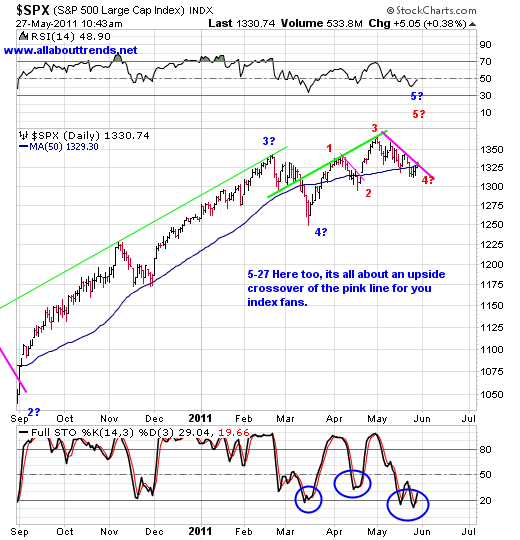
First off in the daily frequency it’s all about the pink downtrend channel. An upside break is what we need to see.
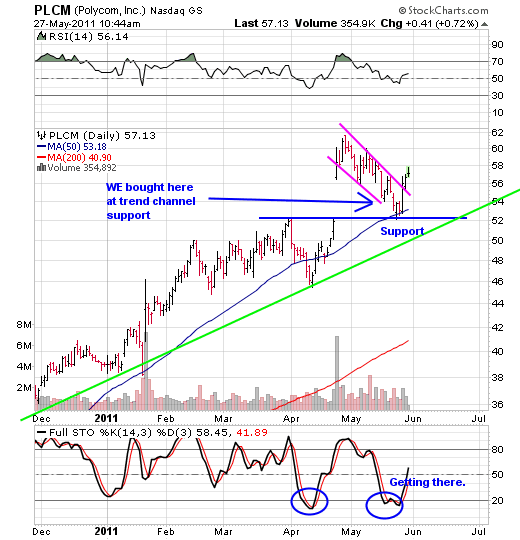
In the 60-minute time frequency take a look at PLCM first. See the downtrend channel? See how it broke above it? That’s exactly what we need to see happen here with regards to the indexes. Of course should we get some rip roaring to the upside from here over the next few days does anyone care to guess what our favorite newspaper is going to say?
Follow Through Day and it’s now ok to consider buying stocks. We say? Really? Most have already moved away from prime low risk POH enty points as shown by the weeks we’ve ALL had here. This is what we mean when we say: ALTERNATIVE ENTRY POINTS
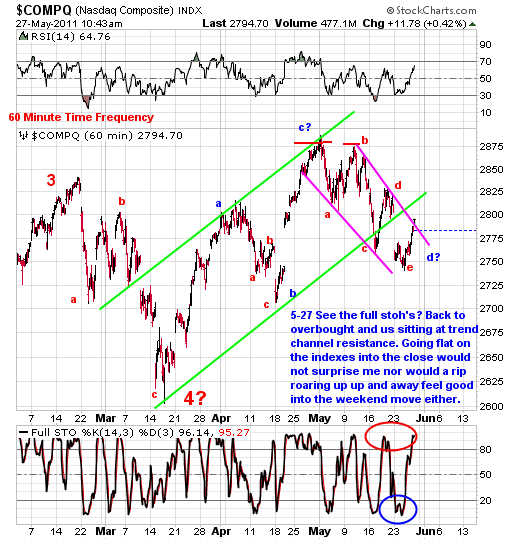
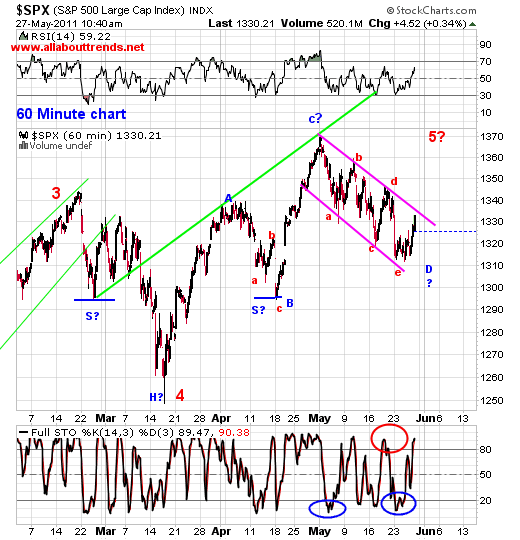
Note: Some of you will observe that the Full Stoh’s on the daily charts are deeply oversold yet on the 60 minute charts are overbought. Why is that? Simple, those are two different time frequencies we are dealing with here.
To learn more, sign up for our free newsletter and receive
By David Grandey
www.allabouttrends.net
To learn more, sign up for our free newsletter and receive our free report -- "How To Outperform 90% Of Wall Street With Just $500 A Week."
David Grandey is the founder of All About Trends, an email newsletter service revealing stocks in ideal set-ups offering potential significant short-term gains. A successful canslim-based stock market investor for the past 10 years, he has worked for Meriwest Credit Union Silicon Valley Bank, helping to establish brand awareness and credibility through feature editorial coverage in leading national and local news media.
© 2011 Copyright David Grandey- All Rights Reserved
Disclaimer: The above is a matter of opinion provided for general information purposes only and is not intended as investment advice. Information and analysis above are derived from sources and utilising methods believed to be reliable, but we cannot accept responsibility for any losses you may incur as a result of this analysis. Individuals should consult with their personal financial advisors.
© 2005-2022 http://www.MarketOracle.co.uk - The Market Oracle is a FREE Daily Financial Markets Analysis & Forecasting online publication.