


Compelling Evidence Extended Stocks Bear Market Rally To End
Stock-Markets / Stocks Bear Market May 15, 2011 - 06:46 AM GMTBy: Garry_Abeshouse

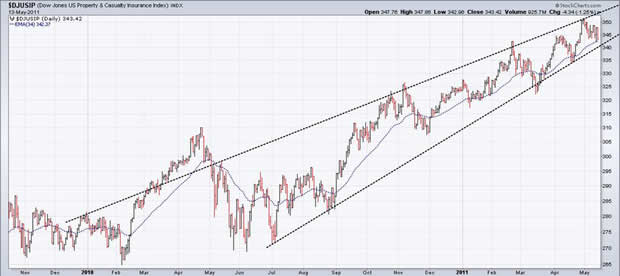
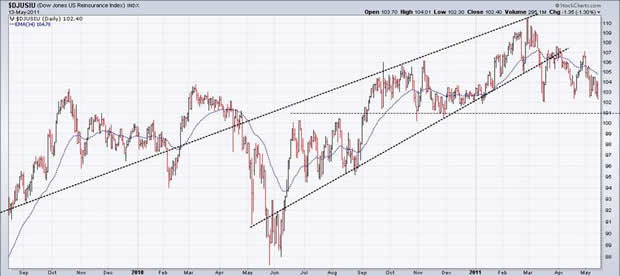
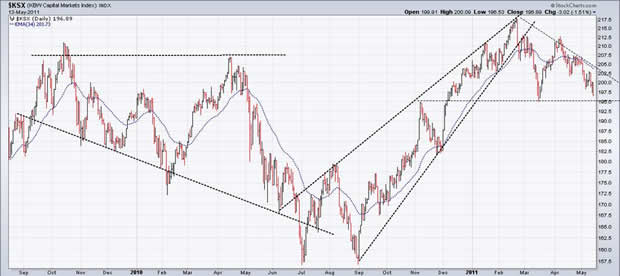
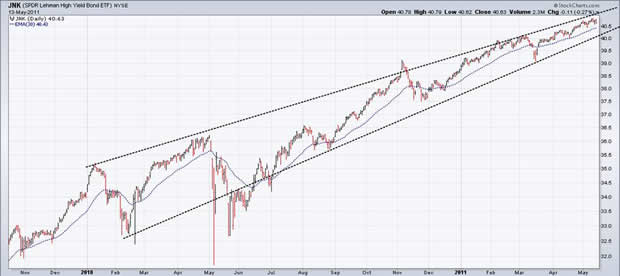
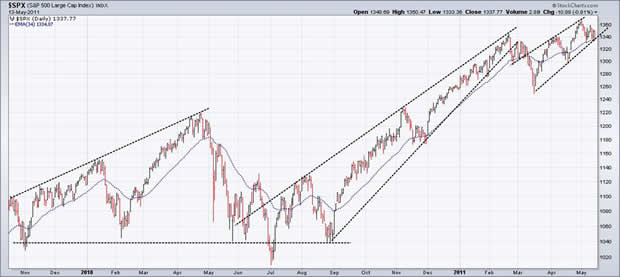
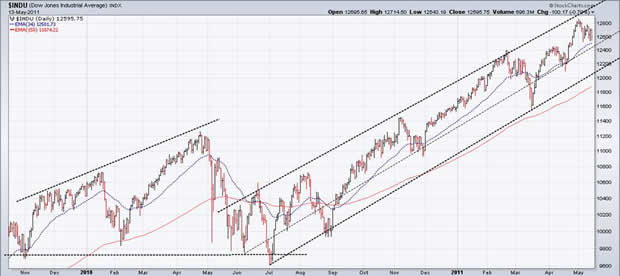
 On November 26th 2010 I posted “My view still is that the rally in equity markets since March 2009, with its persistence of upward wedges and broadening top formations across such a broad range of financial entities and time frames, is compelling evidence of an extended bear market rally that will soon end.”
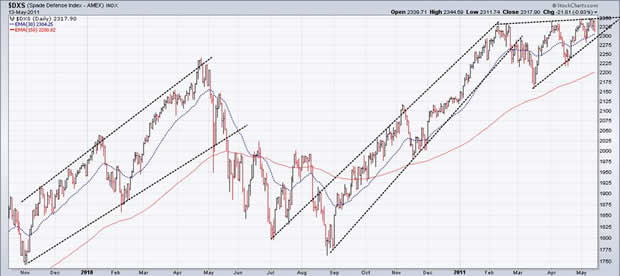
In my last posting on January 24th 2011, I wrote that equity markets were overextended, with upward wedge patterns and broadening formations still predominating in most of the leading US and world equity market indices.
Let me state now that nothing much has changed, except that many uptrends in equities have been broken and that probable tops continue to mature.
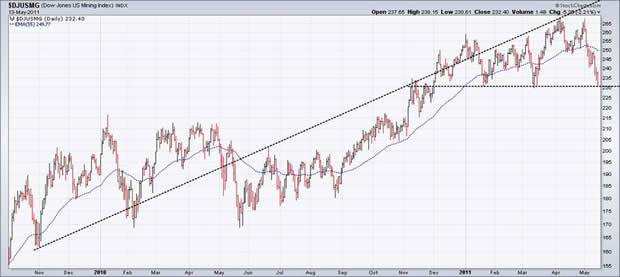
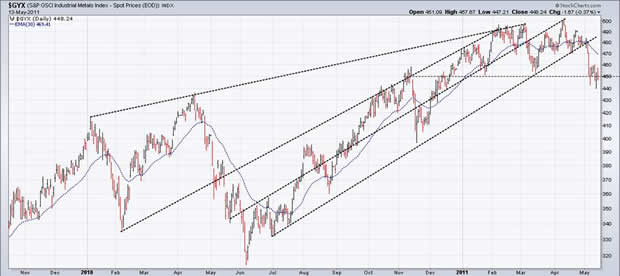
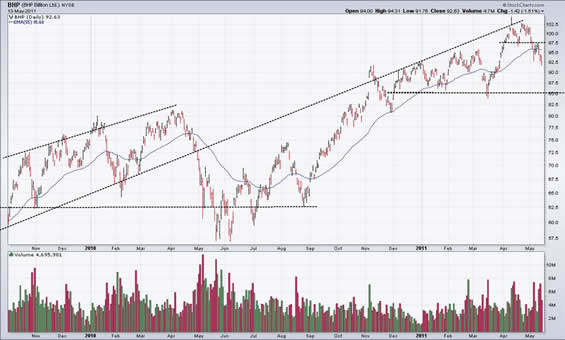
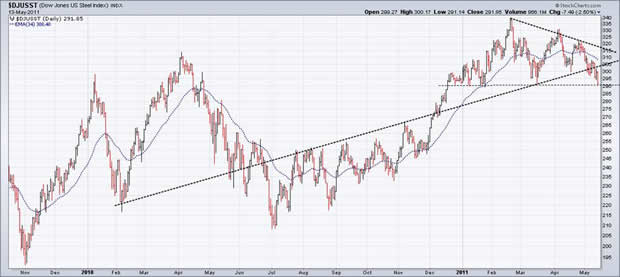
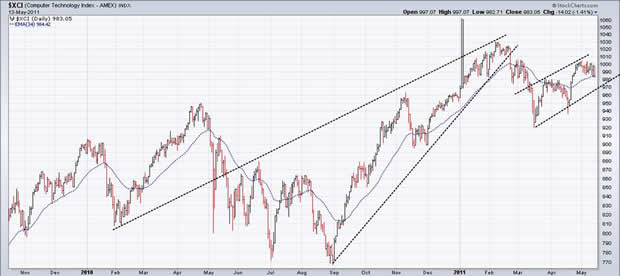
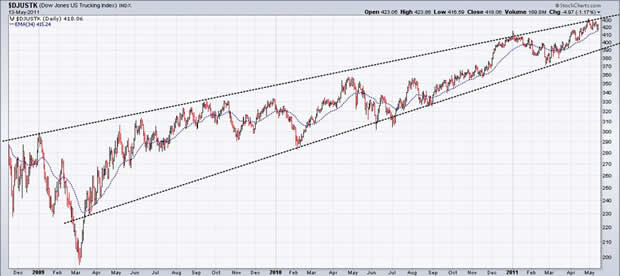
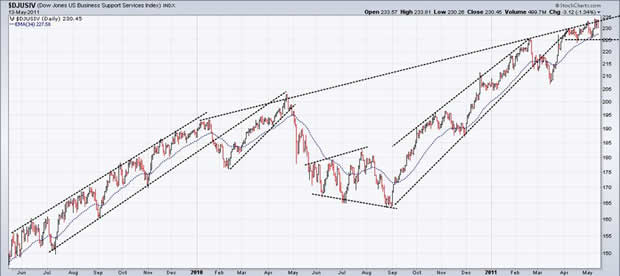
Pattern and trend analysis of key US Sector Indices highlight the mostly negative features over the short term. They also show clearly that the market as a whole is in a major decision mode, with very little room to move before one will be made. Note the close correlation between charts of the Mining Index, the Industrial Metals Index and BHP – where one goes the three will go and where these three go the rest of the market will follow – including the Australian Dollar.
Over the last few months, equities and metal prices have deviated from the mean to bullish levels approaching the elastic limit of where they can go. Barring the traditional US “pulling the proverbial bullish financial rabbit out of a hat”, I expect the emphasis to remain on a topping out process, sensitive in the short term to a testing of current price support levels. If and when support lines , as shown in some of the charts below, are decisively broken, then money flowing out of equities and corporate bonds must go somewhere and that somewhere I expect will be US T-Bonds and the USD.
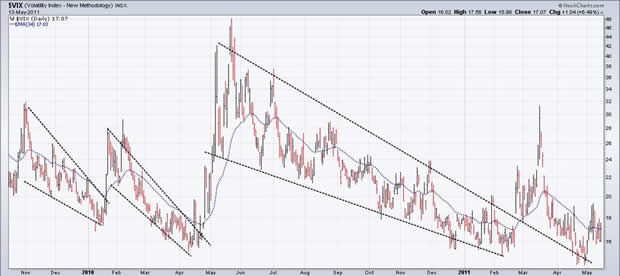
The VIX chart also indicates high risk, showing a level of complacency more associated over the last few years with future market weakness rather than strength.
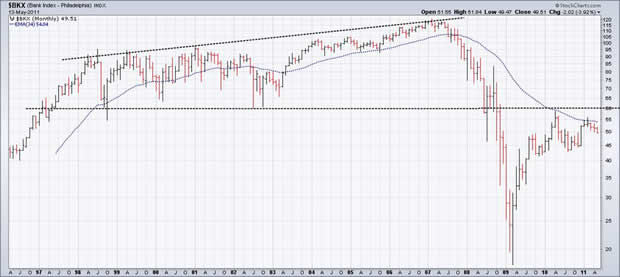
More than two years after an equity market rally that started in March 2009, the US Bank Index is still sitting below the neckline of an 11 year top. It is fascinating to me, that despite socializing the debts of a 30 year speculative frenzy with a multi-billion dollar bail out by the US government and the use of essentially free money to gamble in the world wide casino of derivative and high frequency trading to generate huge ongoing profits, the monthly Bank Chart below remains an ongoing testament and threat to a more bearish longer term future of equities in general.
Perhaps what this chart is trying to tell us, is that the combination of past indiscretions and the hundreds of trillions of dollars of corporate money sloshing around the world as indescribable “virtual” derivatives, will sometime soon come back to bite the banks on their collective virtual backside. It should be remembered that the world’s financial media and economists faced with a similar situation back in 2007/2008, also failed miserably to anticipate the GFC at that time. Not much has changed in this regard and equity prices in the USA are back to where they were prior to the recent GFC only three short years ago.
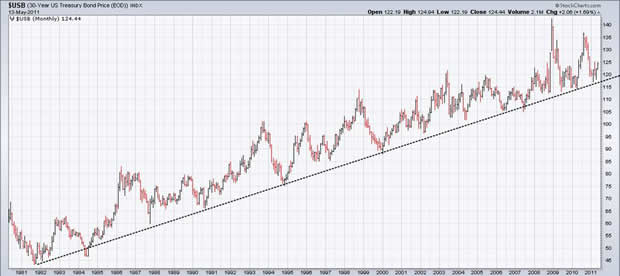
Current chart weakness in the Euro and the British Pound, together with an uncomfortably high AUD, coupled with a basing out of US 10yr T-Notes and 30yr T-Bonds prices, suggests that the US T-Bonds will most likely be the bullish recipients of falling equities – at least for the short to medium term. On my Comex charts the 10yr T-Notes and 30yr T-Bonds are both sitting just under five month resistance lines, whose upside penetration (through 123 – 10yr and 125 – 30yr) is a critical contrary move to any sustained downward move in equities.
While the USD on the charts is still sensitive to a move down for a testing of lower prices, it historically has shown an unnerving tendency to go straight up with minimal retracements in times of increased financial uncertainty. The same would apply to US government bond prices with the US 30yr T-Bonds (see second last chart) showing an uninterrupted uptrend still intact after a long 30 years.
Till next time.
Garry Abeshouse
Technical Analyst.
Sydney
Australia
I have been practicing Technical Analysis since 1969, learning the hard way during the Australian Mining Boom. I was Head Chartist with Bain & Co, (now Deutsch Bank)in the mid 1970's and am now working freelance. I am currently writing a series of articles for the international "Your Trading Edge" magazine entitled "Market Cycles and Technical Analysis".
I have always specialised in medium to long term market strategies and after discovering the excellent Point & Figure Charts from Stockcharts.com in mid 2008, have concentrated on this style of charting ever since.
© Copyright Garry Abeshouse 2011
Disclaimer: The above is a matter of opinion provided for general information purposes only and is not intended as investment advice. Information and analysis above are derived from sources and utilising methods believed to be reliable, but we cannot accept responsibility for any losses you may incur as a result of this analysis. Individuals should consult with their personal financial advisors.
© 2005-2022 http://www.MarketOracle.co.uk - The Market Oracle is a FREE Daily Financial Markets Analysis & Forecasting online publication.