


Stock Market Weakening Uptrend
Stock-Markets / Stock Markets 2011 May 14, 2011 - 07:30 AM GMTBy: Tony_Caldaro

 The US market started the week at SPX 1340, then gyrated to 1359-1332-1351-1333, and ended the week at 1338. Overall the SPX/DOW were -0.25% and the NDX/NAZ were -0.10%. Asian markets lost 0.4%, European markets lost 1.2%, the Commodity equity group was 2.2% lower, and the DJ World index lost 1.2%. On the economic front positive reports outnumbered negative reports by 11 to 3. The negatives were declines in the Monetary base, the WLEI, and an increase in the Trade deficit. On the positive side were increases in Wholesale/Business inventories, Consumer sentiment and Retail sales. The Budget deficit, M1-multiplier and Jobless claims improved. Remaining positive were the PPI/CPI and Import/Export prices. Next week Housing, Industrial production and the May FOMC minutes.
LONG TERM: bull market
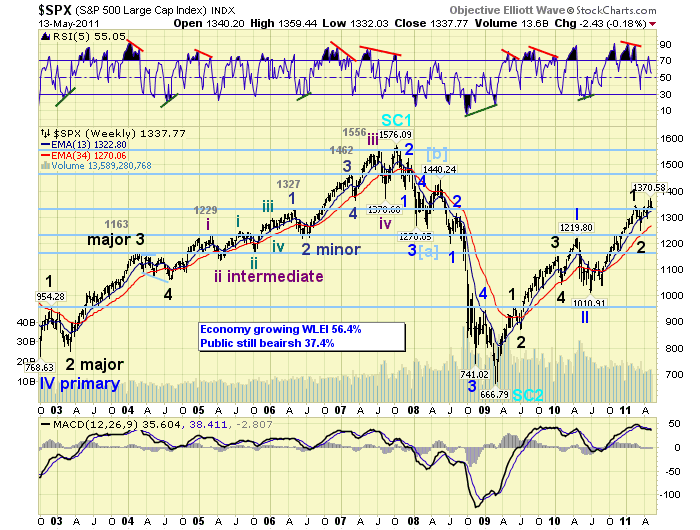
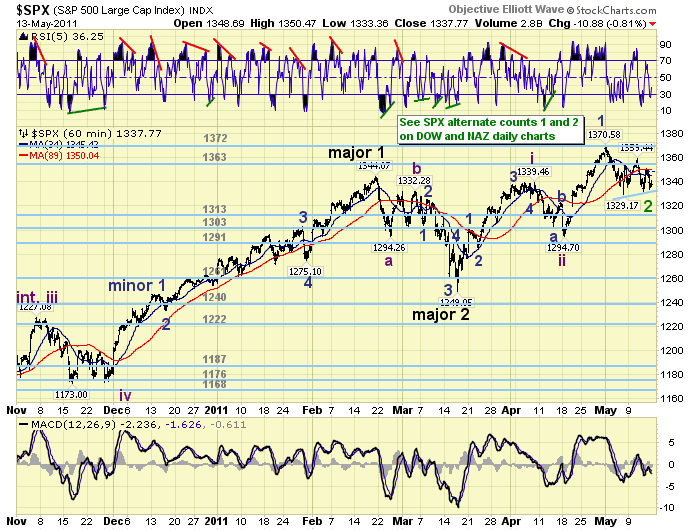
The long term picture has not changed since we turned bullish in January 2010 after identifying, within a week, the bear market price low in March 2009 at SPX 667. This bull market is unfolding in five Primary waves. The first two Primary waves completed at SPX 1220 in April 2010 and at SPX 1011 in July 2010. Primary wave III has been underway since that July low. The first Primary wave divided into five Major waves as labeled in the chart below. Primary wave III is also dividing into five Major waves. Major wave 1 ended in February 2011 at SPX 1344 and Major wave 2 March 2011 at SPX 1249. Major wave 3 should be underway since that March low. However, Major wave 3 may not have started yet. Details below. Whether or not the current uptrend is Major wave 3 does not change the overall long term picture of a retest of the old highs in early 2012.
MEDIUM TERM: uptrend high SPX 1371
Six weeks into the current uptrend, the expected Major wave 3, the market was rising as expected. During the past two weeks, however, the US market stalled, most of the Asian markets confirmed downtrends along with all the Commodity equity markets, and most Commodities are in corrections. In this market, this type of activity is not what would be expected to occur during a Major wave 3 of a Primary wave III – usually the strongest part of the bull market. As a result of this recent activity we offered two medium term alternate counts last week.
After a review of all the charts we find 4 of the 5 Asian markets in confirmed downtrends, all 3 of the Commodity equity markets we track in confirmed downtrends, and 1 European index very close to confirming a downtrend. Also, 4 of the 5 Commodity sectors are in confirmed downtrends, and now 3 of the 9 SPX sectors are in confirmed downtrends. On the currency front the USD is uptrending, and the EUR, CAD and ZAR are downtrending. Many of these markets are going in the opposite direction of what we would expect during a Major 3 of Primary III.
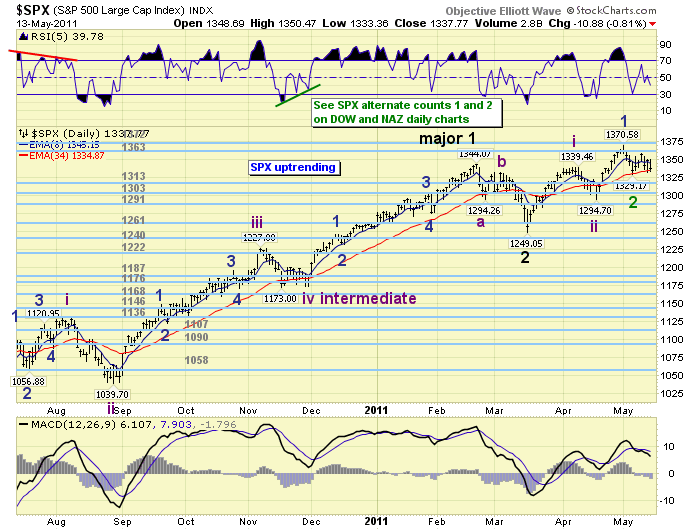
While the US market remains with an uptrend status it currently stands about in the middle of extending the uptrend and confirming a downtrend. In fact, the actual print high was posted the first trading day in May on the belated ”Osama bin Laden has been killed” news. Several of the above noted markets were sold heavily that week, especially Crude and Silver. While we maintain the bullish count above we just updated the following alternate count to the most probable of the two alternates.
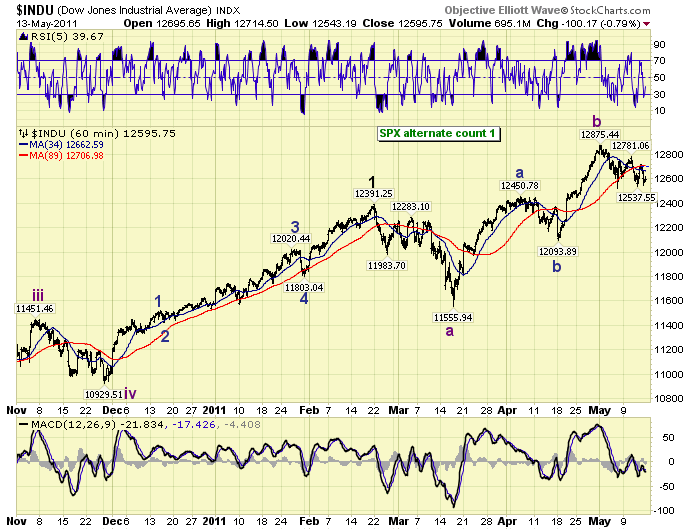
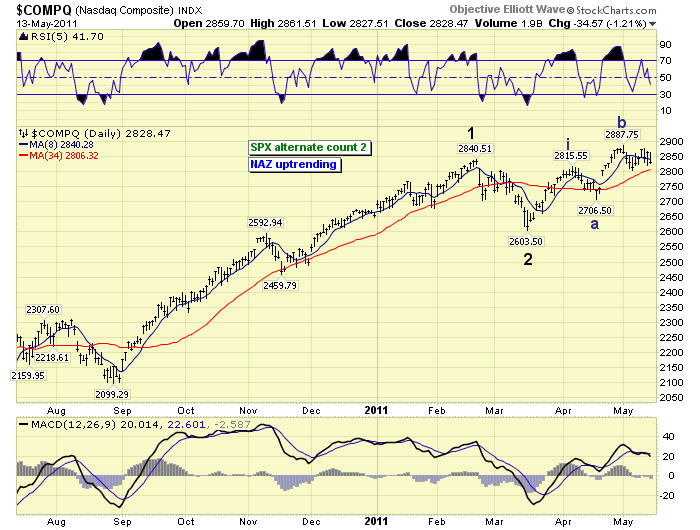
The following alternate count would be the less probable of the two.
SHORT TERM
Support for the SPX remains at 1313 and then 1303, with resistance at 1363 and then 1372. Short term momentum ended the week bouncing off of slightly oversold. We still maintain a count of an Intermediate i and ii completed at SPX 1339 and 1295, and a Minor 1 at 1371 and a Minor 2 currently underway. A decline, however, to the SPX 1295 level would not only eliminate this count but also force a shift to the first alternate count above.
The key levels to observe on the downside are actually a bit higher. First the recent 1329 low posted a week ago thursday. Then the OEW 1313 pivot range is most important support. Should the market break through the 7 point pivot range and enter hit the 1303 pivot we’re likely to get a downtrend confirmation. If this occurs the Intermediate wave ii SPX 1295 low will not matter much. On the upside, the market will need to break through the OEW 1363 pivot range and then clear the 1371 uptrend high to resume its uptrend. While this market is deciding its next important move caution is advised. Best to your trading!
FOREIGN MARKETS
Asian markets were mixed on the week for a net loss of 0.4%. Four of five downtrending.
European markets were mostly lower for a net loss of 1.2%. All five still uptrending.
The Commodity equity group were all lower for a net loss of 2.2%. All three downtrending.
The uptrending DJ World index lost 1.2%.
COMMODITIES
Bonds continue to uptrend gaining 0.2% on the week.
Crude has been downtrending but gained 2.4% on the week.
Gold remains in an uptrend but finished flat for the week. Silver is downtrending, and Platinum has nearly confirmed a downtrend.
The uptrending USD gained 1.2% on the week. The downtrending EUR lost 1.4%, and the uptrending JPY lost -0.1%.
NEXT WEEK
Economic reports start monday in this Options expiration week. The NY FED will be reported at 8:30, then the NAHB housing index at 10:00. On tuesday Housing starts, Building permits and Industrial production will be reported. Wednesday is the FOMC minutes, and thursday wraps up the week with Jobless claims, Existing homes sales, the Philly FED and Leading indicators. There is nothing currently on the FED agenda. Best to you and yours this weekend and week!
CHARTS: http://stockcharts.com/...http://caldaroew.spaces.live.com
After about 40 years of investing in the markets one learns that the markets are constantly changing, not only in price, but in what drives the markets. In the 1960s, the Nifty Fifty were the leaders of the stock market. In the 1970s, stock selection using Technical Analysis was important, as the market stayed with a trading range for the entire decade. In the 1980s, the market finally broke out of it doldrums, as the DOW broke through 1100 in 1982, and launched the greatest bull market on record.
Sharing is an important aspect of a life. Over 100 people have joined our group, from all walks of life, covering twenty three countries across the globe. It's been the most fun I have ever had in the market. Sharing uncommon knowledge, with investors. In hope of aiding them in finding their financial independence.
Copyright © 2011 Tony Caldaro - All Rights Reserved Disclaimer: The above is a matter of opinion provided for general information purposes only and is not intended as investment advice. Information and analysis above are derived from sources and utilising methods believed to be reliable, but we cannot accept responsibility for any losses you may incur as a result of this analysis. Individuals should consult with their personal financial advisors.
© 2005-2022 http://www.MarketOracle.co.uk - The Market Oracle is a FREE Daily Financial Markets Analysis & Forecasting online publication.