


Stock Market Reversal, Without Vision the People Perish
Stock-Markets / Stock Markets 2011 May 14, 2011 - 06:42 AM GMT

 Nobody can see the future, except of course for a real prophet. I'm not one. Real prophets come along to show us the way very rarely. One of the signs of a true prophet is often that they are run out of town on rails, long before the world realizes that they actually had a glimpse of the future and its too late to heed their warning.
To be clear, a real prophet is focused on more important issues than advances and reversals in the S&P 500. If a financial market analyst tells you they actually know exactly what will occur in the future in any given market, they are selling you a bill of goods. The point of technical analysis and the study of stock market cycles are to develop valid methods that increase your odds of anticipating important future turns in the market. The ulitmate objective of technical and market cycle analysis is to increase your odds of being on the right side of the market in your investing and trading. Obviously, being on the wrong side of a market cycle greatly increases your risks and can put a dent in your trading and investment performance.
This brings us to the technical tool of Fibonacci ratios and the 1361 target. Fibonacci ratios in market price moves give you a heads up regarding a rapidly rising probability that a turn in a market cycle could be ahead. The Fibonacci target might not trigger a turn, but investing and trading is a game of odds. As an investor or trader, you want to put the odds on your side. This makes Fibonacci ratios a form of leading indicator, meaning they tell you something in advance as opposed to being lagging indicators, which inform you of a new trend after the change in trend has occurred.
Applying Fibonacci ratios correctly is one of the most rewarding endeavors in technical analysis of global financial markets. The chart below demonstrates the Level 1 grid in the S&P 500, which is the 1982 low and the 2007 high. The Level 1 grid is the most important long-term move in a market. The grid includes not just the Fibonacci ratios of 61.8%, 38.2%, 23.6%, 15.4%, etc. but it also draws the compliment ratios over 61.8% on the way to 100% of the entire move. This means that 76.4%, 85.4%, etc. are also Fibonacci ratios in the grid.
Those who don't think Fibonacci ratios can be used to anticipate a move in the market, need to study the chart below. This chart was created with Long Wave Dynamics, LLC. Market Cycle Dynamics (MCD) software, which is slated for release later this month. It is important to notice where the global financial crisis and the market's descent into the abyss in March 2009 made its infamous turn, which was right smack on the 38.2% inverse golden ratio. The golden ratio of the Level 1 grid at 1013 stopped the decline last summer, after 1228, the 76.4% L1 target stopped the rally last spring. Clearly, you should always pay attention to Level 1 Fibonacci targets in any market or security you invest in or trade. The business cycles (aka Kitchin cycles) since 1982 are also included on this monthly chart and identified using the 21 period fast stochastics.
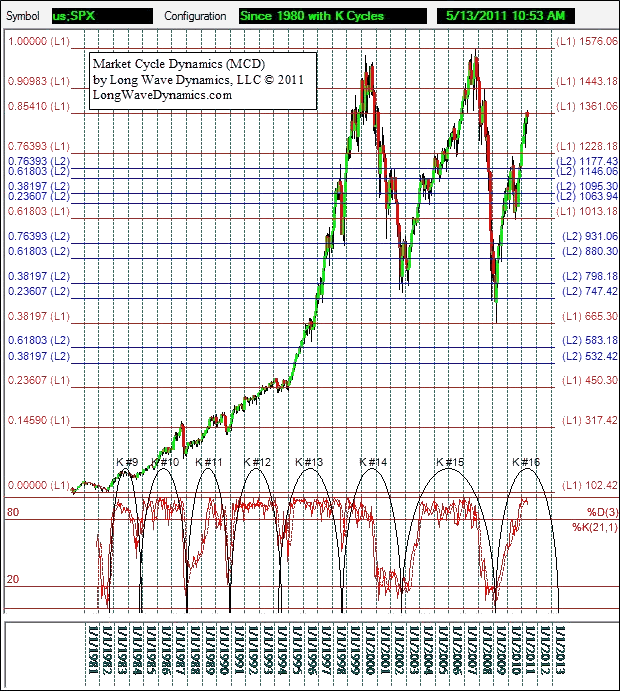
The Level 1 Fibonacci grid in the S&P 500 is important currently because a reversal just occurred at a Level 1 target price. Mr. Market is now back under the latest Level 1 target in this grid, the 84.5% 1361.06 target. A Level 1 target in any market index, individual security, bond or commodity, greatly increases the odds for an important market turn. A turn is not guaranteed, but the odds of a turn rise sharply at Level 1 price targets.
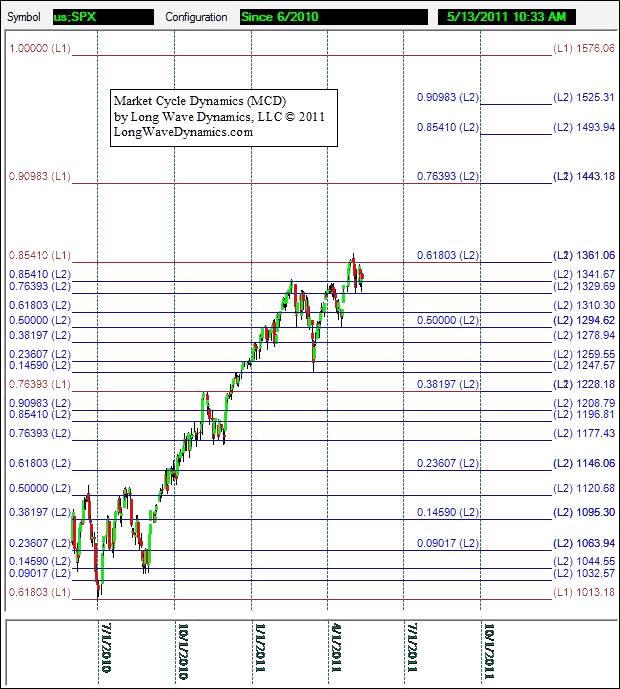
The Fibonacci Level 2 grids can be generated in two different ways. The first way is you create a Level 2 grid between two adjacent Fibonacci ratios in the Level 1 grid, using the adjacent Level 1 targets as 0% and 100% in the new grid. The market turns on the targets in Level 2 grids will change your views of investing and trading forever.
Another way to create a Level 2 range is to take one of the Dynamic Web Ranges in the Level 1 grid and create a Level 2 grid out of the high and low in that range. Dynamic Web Ranges in a Fibonacci Grid are as follows; Solitary Range 0-38.2%, Normal Range 38.2-61.8%, Frenzy Range 61.8-100%. In the S&P 500 Level 1 chart above the Frenzy range runs from the golden ratio at 1013 up to the 2007 high at 1576. When you create a Level 2 Dynamic Web Range of the Level 1 Frenzy Range, you find that the 1361 target becomes the golden ratio target in this Level 2 range. Investors and traders ignore golden ratios in markets at your peril.
You have to look at the Level 1 and Level 2 Fibonacci grid along with other indicators. Stochastics are a leading indicator. The time cycles are also a technical indicator. The regular business cycle has been regularly flowing from boom to bust for hundreds if not thousands of years, and the one that began in March 2009 has reached its mid-point. There are indications the current business cycle is rolling over and could begin its descent earlier than cycles in recent years. Then there are the smaller cycles. The Wall cycle that just began on March 16, 2011 has had a nice 10% run. It is showing signs of being in the topping phase. There are nine Wall cycles in every business cycle.
Getting back to the subject of real prophets and figuring out the future. I was working on this article with a fresh cup of hot coffee, had already started with the awkward prophet theme combined with Fibonacci ratios, and was thinking about scraping it. It was then that out of the blue a friend emailed me a Biblical reference, suggesting it has implications for the pricing mechanism of markets that I should ponder. Maybe it was a sign that I should pass it along for you to ponder as well dear reader.
The reference was Amos 8: 5-8. All of you Biblical scholars know, Amos was a real prophet. He wrote, "When will the New Moon be past, that we may sell grain? And the Sabbath, that we may trade wheat? Making the ephah small and the shekel large, falsifying the scales by deceit, that we may buy the poor for silver, and the needy for a pair of shoes, even sell bad wheat? The Lord has sworn by the pride of Jacob; 'Surely I will never forget any of their works. Shall the land not tremble for this, and everyone mourn who dwells in it? All of it shall swell like the river Nile, heave and subside, like the river of Egypt."
Amos' prophetic vision as we read it from 2500 years in the future gives one pause. Rising wheat prices have sowed the seeds of revolution around the world, in part due to quantitative easing, modern day fancy words for weighted scales and under-sized measures. Crashing silver prices from reductions in allowable margin debt are in the news as speculators get their positions called, and some loose their shirts, and maybe their shoes. The bankers are privatizing their profits and socializing their losses as fast as they can. Currency wars, where nations are debasing their currencies to increase their exports are accepted monetary policy. The mighty Mississippi is rising.
It is not a prophecy, just technical analysis, but the increased odds that the S&P 500 reversal at the Fibonacci 1361.06 target portends a global shift from risk on to risk off is a matter all investors and traders in global markets should consider. It is possible the 1361 target is exceeded, and the post 2009 rally heads higher to the next Level 1 target at 1443. The objective of Fibonacci grid and market cycle technical analysis is to identify the high probability entry, exit and stop-loss targets that protect your profits and limit your losses. Prophets and profits are two different subjects, but both have implications for your future, so keep an open mind, and a sharp eye on S&P 500 1361.
David Knox Barker is a long wave analyst, technical market analyst, world-systems analyst and author of Jubilee on Wall Street; An Optimistic Look at the Global Financial Crash, Updated and Expanded Edition (2009). He is the founder of LongWaveDynamics.com, and the publisher and editor of The Long Wave Dynamics Letter and the LWD Weekly Update Blog. Barker has studied and researched the Kondratieff long wave “Jubilee” cycle for over 25 years. He is one of the world’s foremost experts on the economic long wave. Barker was also founder and CEO for ten years from 1997 to 2007 of a successful life sciences research and marketing services company, serving a majority of the top 20 global life science companies. Barker holds a bachelor’s degree in finance and a master’s degree in political science. He enjoys reading, running and discussing big ideas with family and friends.© 2011 Copyright David Knox Barker - All Rights Reserved Disclaimer: The above is a matter of opinion provided for general information purposes only and is not intended as investment advice. Information and analysis above are derived from sources and utilising methods believed to be reliable, but we cannot accept responsibility for any losses you may incur as a result of this analysis. Individuals should consult with their personal financial advisors.
© 2005-2022 http://www.MarketOracle.co.uk - The Market Oracle is a FREE Daily Financial Markets Analysis & Forecasting online publication.