


Five Ways Elliott Wave Theory Can Improve Your Trading
InvestorEducation / Elliott Wave Theory May 13, 2011 - 02:18 AM GMTBy: EWI

 Jeffrey Kennedy brings more than 15 years of experience to his position as Elliott Wave International’s Senior Analyst and trading instructor. He knows firsthand how hard it can be to get simple explanations of a trading method that works -- so he shares his knowledge with his subscribers each month in the Trader's Classroom lessons.
Here's an excerpt from The Best of Trader's Classroom, a free 45-page eBook that gives you the 14 most critical lessons every trader should know. Download the full eBook free here.
Every trader, every analyst and every technician has favorite techniques to use when trading. But where traditional technical studies fall short, the Wave Principle kicks in to show high-probability price targets. Just as important, it can distinguish high-probability trade setups from the ones that traders should ignore.
Where Technical Studies Fall Short
There are three categories of technical studies: trend-following indicators, oscillators and sentiment indicators. Trend-following indicators include moving averages, Moving Average Convergence-Divergence (MACD) and Directional Movement Index (ADX). A few of the more popular oscillators many traders use today are Stochastics, Rate-of-Change and the Commodity Channel Index (CCI). Sentiment indicators include Put-Call ratios and Commitment of Traders report data.
Technical studies like these do a good job of illuminating the way for traders, yet they each fall short for one major reason: they limit the scope of a trader's understanding of current price action and how it relates to the overall picture of a market. For example, let's say the MACD reading in XYZ stock is positive, indicating the trend is up. That's useful information, but wouldn't it be more useful if it could also help to answer these questions: Is this a new trend or an old trend? If the trend is up, how far will it go? Most technical studies simply don't reveal pertinent information such as the maturity of a trend and a definable price target -- but the Wave Principle does.
How Does the Wave Principle Improve Trading?
Here are five ways the Wave Principle improves trading:
1. Identifies Trend The Wave Principle identifies the direction of the dominant trend. A five-wave advance identifies the overall trend as up. Conversely, a five-wave decline determines that the larger trend is down. Why is this information important? Because it is easier to trade in the direction of the dominant trend, since it is the path of least resistance and undoubtedly explains the saying, "the trend is your friend."
2. Identifies Countertrend The Wave Principle also identifies countertrend moves. The three-wave pattern is a corrective response to the preceding impulse wave. Knowing that a recent move in price is merely a correction within a larger trending market is especially important for traders because corrections are opportunities for traders to position themselves in the direction of the larger trend of a market.
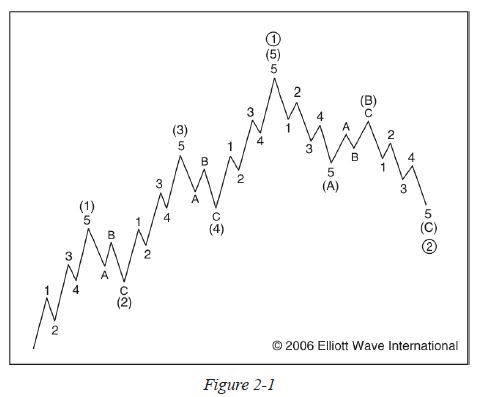
3. Determines Maturity of a Trend As Elliott observed, wave patterns form larger and smaller versions of themselves. This repetition in form means that price activity is fractal, as illustrated in Figure 2-1. Wave (1) subdivides into five small waves, yet is part of a larger five-wave pattern. How is this information useful? It helps traders recognize the maturity of a trend. If prices are advancing in wave 5 of a five-wave advance for example, and wave 5 has already completed three or four smaller waves, a trader knows this is not the time to add long positions. Instead, it may be time to take profits or at least to raise protective stops.
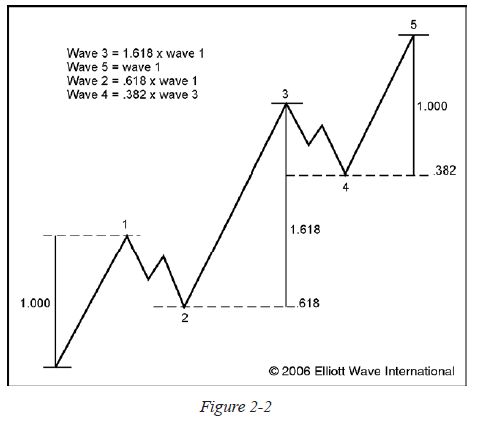
4. Provides Price Targets What traditional technical studies simply don't offer -- high-probability price targets -- the Wave Principle again provides. When R.N. Elliott wrote about the Wave Principle in Nature's Law, he stated that the Fibonacci sequence was the mathematical basis for the Wave Principle. Elliott waves, both impulsive and corrective, adhere to specific Fibonacci proportions, as illustrated in Figure 2-2. For example, common objectives for wave 3 are 1.618 and 2.618 multiples of wave 1. In corrections, wave 2 typically ends near the .618 retracement of wave 1, and wave 4 often tests the .382 retracement of wave 3. These high-probability price targets allow traders to set profit-taking objectives or identify regions where the next turn in prices will occur.
5. Provides Specific Points of Ruin At what point does a trade fail? Many traders use money management rules to determine the answer to this question, because technical studies simply don't offer one. Yet the Wave Principle does -- in the form of Elliott wave rules.
Rule 1: Wave 2 can never retrace more than 100% of wave 1.
Rule 2: Wave 4 may never end in the price territory of wave 1.
Rule 3: Out of the three impulse waves -- 1, 3 and 5 -- wave 3 can never be the shortest.A violation of one or more of these rules implies that the operative wave count is incorrect. How can traders use this information? If a technical study warns of an upturn in prices, and the wave pattern is a second wave pullback, the trader knows specifically at what point the trade will fail -- a move beyond the origin of wave 1. That kind of guidance is difficult to come by without a framework like the Wave Principle.
Technical studies can pick out many trading opportunities, but the Wave Principle helps traders discern which ones have the highest probability of being successful. This is because the Wave Principle is the framework that provides history, current information and a peek at the future. When traders place their technical studies within this strong framework, they have a better basis for understanding current price action.
Don't miss the rest of the 14 most critical lessons that every trader should know. Download the free 45-page eBook The Best of Trader's Classroom.
This article was syndicated by Elliott Wave International and was originally published under the headline 5 Ways the Wave Principle Can Improve Your Trading. EWI is the world's largest market forecasting firm. Its staff of full-time analysts led by Chartered Market Technician Robert Prechter provides 24-hour-a-day market analysis to institutional and private investors around the world.
© 2005-2022 http://www.MarketOracle.co.uk - The Market Oracle is a FREE Daily Financial Markets Analysis & Forecasting online publication.
Comments
|
sharetipsinfo
19 Jul 11, 06:19 |
Indian stock market tips
Dear Visitor, for the visitors. Would like to add few notes here like if we are trading in Share market say specially in NSE and BSE which are one of the most popular stock exchanges of the world then we need to take care of the few things like 1. Never overtrade 2. Avoid emotional trading decision 3. Don’t work on layman’s advise 4. Always seek professional support before investing your hard earned money 5. Its good to trade with strict stoploss always. 6. Rely on research rather than speculation. To name few. This is for sure if we follow above 6 points then we can always stay in profit. Its just like how investors and traders approach them. Regards |